| Red | Green | Blue | |
| z | 17.64 | ||
| znorm | Inf | ||
| sky | -Inf | -Inf | -Inf |
| S/N | 24.7 | 43.5 | 44.8 |
| S/N(c) | 0.0 | 0.0 | 0.0 |
| SN(E/C) |
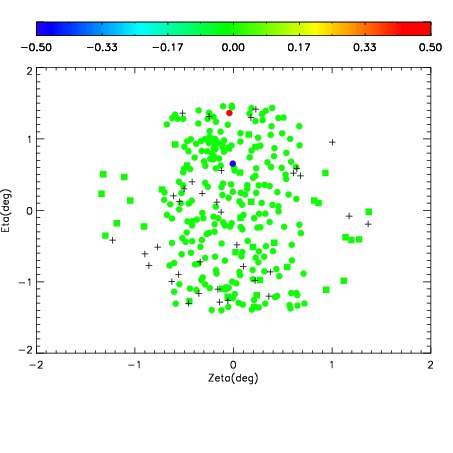
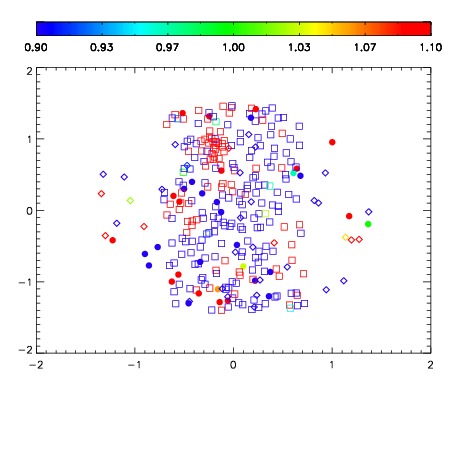
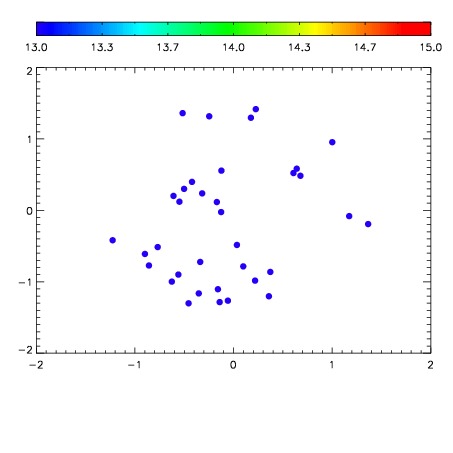

| Frame | Nreads | Zeropoints | Mag plots | Spatial mag deviation | Spatial sky 16325A emission deviations (filled: sky, open: star) | Spatial sky continuum emission | Spatial sky telluric CO2 absorption deviations (filled: H < 10) | |||||||||||||||||||||||
| 0 | 0 |
|
|
|
|
|
|
| IPAIR | NAME | SHIFT | NEWSHIFT | S/N | NAME | SHIFT | NEWSHIFT | S/N |
| 0 | 10280025 | 0.498002 | 0.00000 | 171.247 | 10280031 | 0.00157739 | 0.496425 | 170.308 |
| 1 | 10280029 | 0.494771 | 0.00323099 | 213.349 | 10280028 | 0.00225399 | 0.495748 | 213.722 |
| 2 | 10280030 | 0.495426 | 0.00257599 | 205.970 | 10280027 | 0.00229329 | 0.495709 | 206.531 |
| 3 | 10280026 | 0.497706 | 0.000295997 | 174.115 | 10280024 | 0.00000 | 0.498002 | 177.127 |