| Red | Green | Blue | |
| z | 17.64 | ||
| znorm | Inf | ||
| sky | -Inf | -NaN | -Inf |
| S/N | 27.0 | 46.5 | 49.8 |
| S/N(c) | 0.0 | 0.0 | 0.0 |
| SN(E/C) |
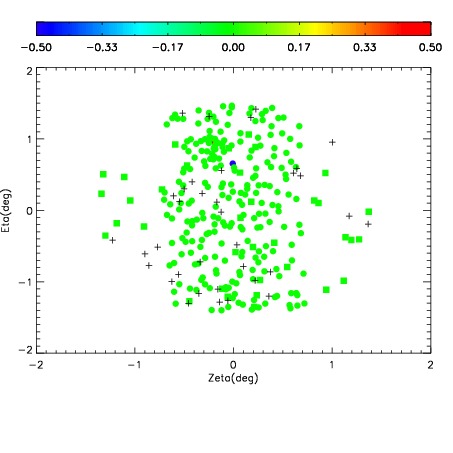
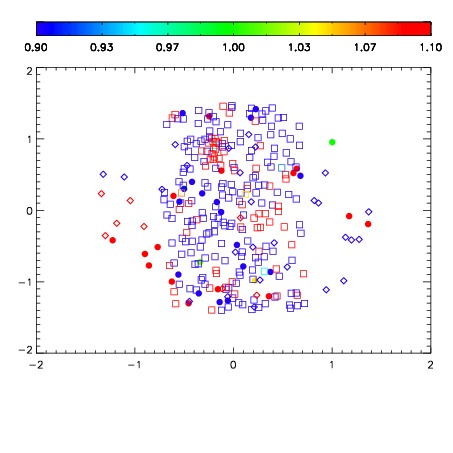
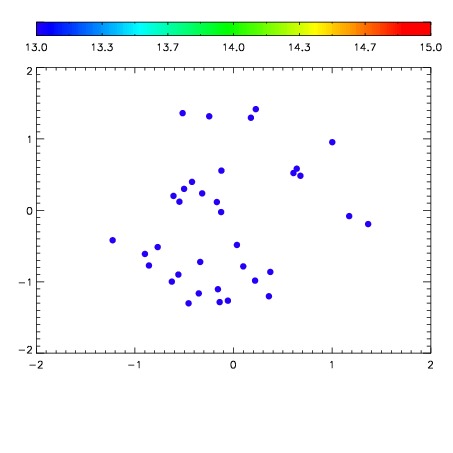

| Frame | Nreads | Zeropoints | Mag plots | Spatial mag deviation | Spatial sky 16325A emission deviations (filled: sky, open: star) | Spatial sky continuum emission | Spatial sky telluric CO2 absorption deviations (filled: H < 10) | |||||||||||||||||||||||
| 0 | 0 |
|
|
|
|
|
|
| IPAIR | NAME | SHIFT | NEWSHIFT | S/N | NAME | SHIFT | NEWSHIFT | S/N |
| 0 | 10490040 | 0.499518 | 0.00000 | 207.406 | 10490039 | 0.00000 | 0.499518 | 204.055 |
| 1 | 10490041 | 0.498767 | 0.000751019 | 213.375 | 10490042 | 0.000412800 | 0.499105 | 211.465 |
| 2 | 10490045 | 0.498923 | 0.000595003 | 199.873 | 10490043 | 0.000797081 | 0.498721 | 200.352 |
| 3 | 10490044 | 0.498452 | 0.00106600 | 199.120 | 10490046 | 0.00331139 | 0.496207 | 197.970 |