| Red | Green | Blue | |
| z | 17.64 | ||
| znorm | Inf | ||
| sky | -Inf | -Inf | -Inf |
| S/N | 29.8 | 49.4 | 52.9 |
| S/N(c) | 0.0 | 0.0 | 0.0 |
| SN(E/C) |
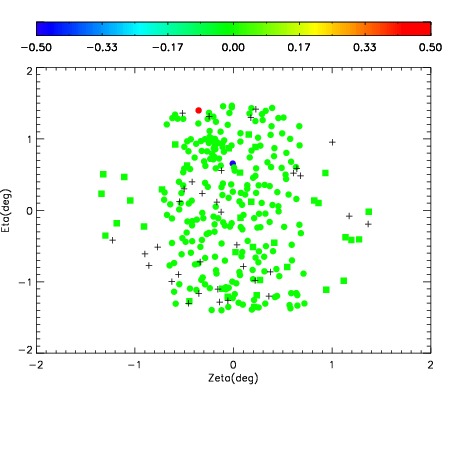
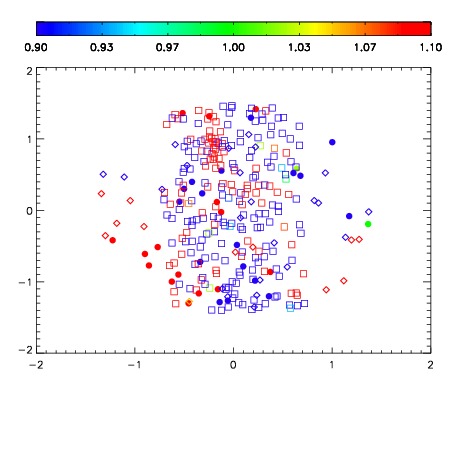
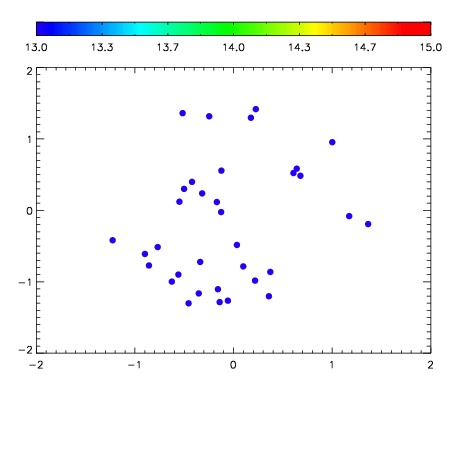

| Frame | Nreads | Zeropoints | Mag plots | Spatial mag deviation | Spatial sky 16325A emission deviations (filled: sky, open: star) | Spatial sky continuum emission | Spatial sky telluric CO2 absorption deviations (filled: H < 10) | |||||||||||||||||||||||
| 0 | 0 |
|
|
|
|
|
|
| IPAIR | NAME | SHIFT | NEWSHIFT | S/N | NAME | SHIFT | NEWSHIFT | S/N |
| 0 | 10750024 | 0.493933 | 0.00000 | 232.552 | 10750026 | -0.000505804 | 0.494439 | 223.815 |
| 1 | 10750023 | 0.493437 | 0.000496000 | 234.179 | 10750025 | -0.000887534 | 0.494821 | 231.107 |
| 2 | 10750027 | 0.492913 | 0.00101998 | 227.653 | 10750022 | 0.00000 | 0.493933 | 222.310 |
| 3 | 10750028 | 0.493064 | 0.000869006 | 226.644 | 10750029 | 0.000652558 | 0.493280 | 216.865 |