| Red | Green | Blue | |
| z | 17.64 | ||
| znorm | Inf | ||
| sky | -Inf | -Inf | -Inf |
| S/N | 19.2 | 33.0 | 37.6 |
| S/N(c) | 0.0 | 0.0 | 0.0 |
| SN(E/C) |

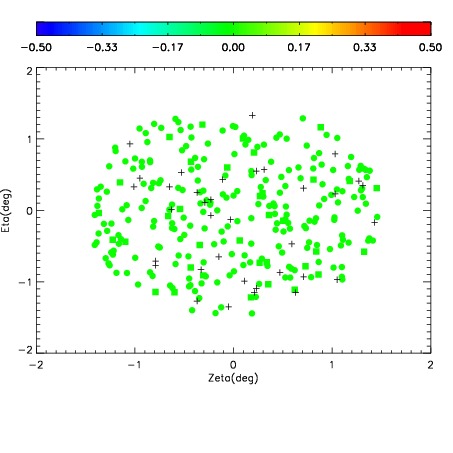
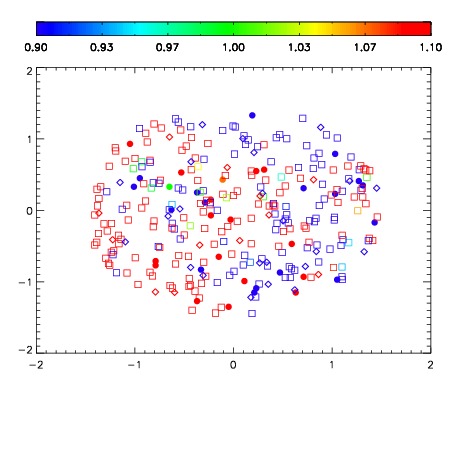
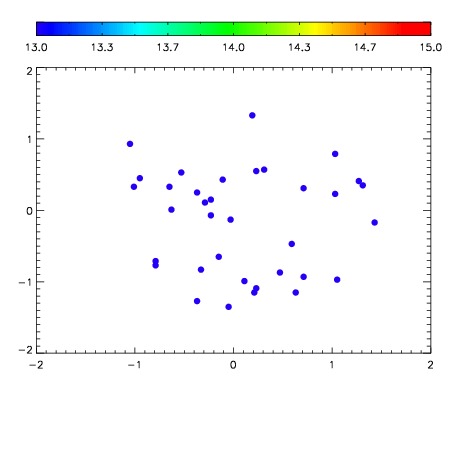

| Frame | Nreads | Zeropoints | Mag plots | Spatial mag deviation | Spatial sky 16325A emission deviations (filled: sky, open: star) | Spatial sky continuum emission | Spatial sky telluric CO2 absorption deviations (filled: H < 10) | |||||||||||||||||||||||
| 0 | 0 |
|
|
|
|
|
|
| IPAIR | NAME | SHIFT | NEWSHIFT | S/N | NAME | SHIFT | NEWSHIFT | S/N |
| 0 | 10730027 | 0.546283 | 0.00000 | 177.728 | 10730026 | 0.0262216 | 0.520061 | 172.407 |
| 1 | 10730028 | 0.546038 | 0.000245035 | 184.781 | 10730029 | 0.0275946 | 0.518688 | 181.455 |
| 2 | 10730024 | 0.515173 | 0.0311100 | 151.707 | 10730025 | 0.0255045 | 0.520779 | 165.011 |
| 3 | 10730023 | 0.515714 | 0.0305690 | 139.542 | 10730022 | 0.00000 | 0.546283 | 163.587 |