| Red | Green | Blue | |
| z | 17.64 | ||
| znorm | Inf | ||
| sky | -Inf | -Inf | -Inf |
| S/N | 23.1 | 37.8 | 42.6 |
| S/N(c) | 0.0 | 0.0 | 0.0 |
| SN(E/C) |
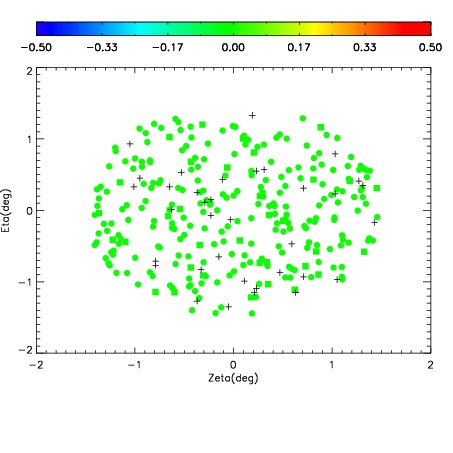
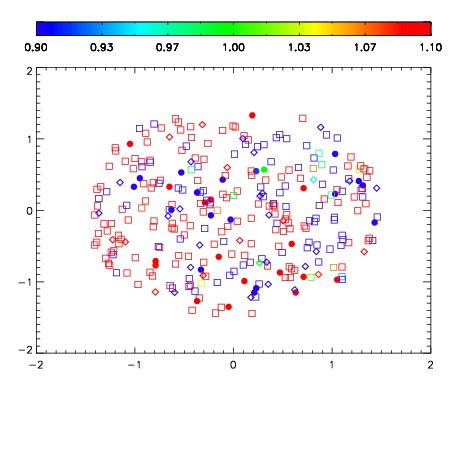
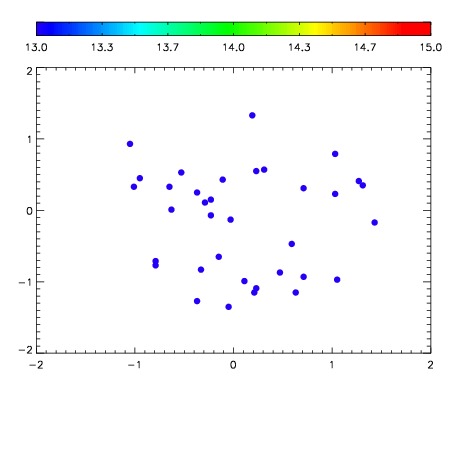

| Frame | Nreads | Zeropoints | Mag plots | Spatial mag deviation | Spatial sky 16325A emission deviations (filled: sky, open: star) | Spatial sky continuum emission | Spatial sky telluric CO2 absorption deviations (filled: H < 10) | |||||||||||||||||||||||
| 0 | 0 |
|
|
|
|
|
|
| IPAIR | NAME | SHIFT | NEWSHIFT | S/N | NAME | SHIFT | NEWSHIFT | S/N |
| 0 | 10840013 | 0.491816 | 0.00000 | 165.300 | 10840014 | -0.00156460 | 0.493381 | 167.399 |
| 1 | 10840016 | 0.489804 | 0.00201201 | 180.818 | 10840018 | -0.00269951 | 0.494516 | 177.579 |
| 2 | 10840017 | 0.489575 | 0.00224102 | 173.414 | 10840015 | -0.00107693 | 0.492893 | 175.059 |
| 3 | 10840012 | 0.491781 | 3.50177e-05 | 154.151 | 10840011 | 0.00000 | 0.491816 | 152.038 |