| Red | Green | Blue | |
| z | 17.64 | ||
| znorm | Inf | ||
| sky | -Inf | -Inf | -Inf |
| S/N | 27.8 | 44.4 | 48.9 |
| S/N(c) | 0.0 | 0.0 | 0.0 |
| SN(E/C) |
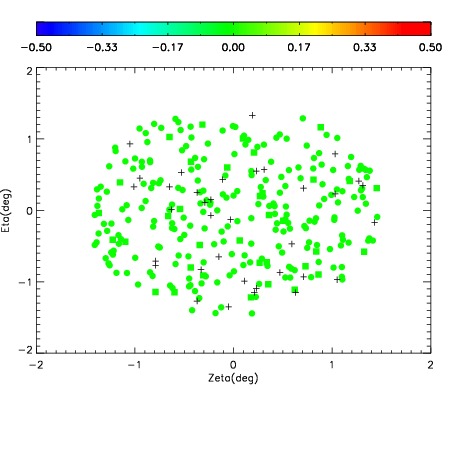
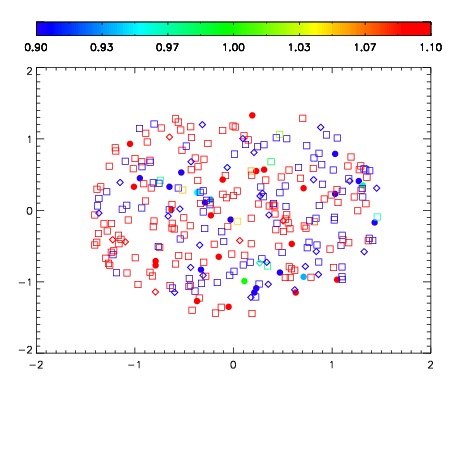
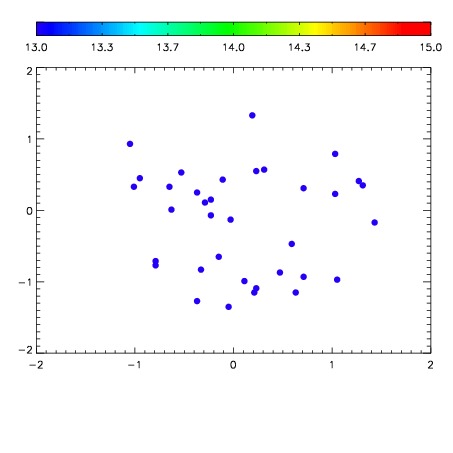

| Frame | Nreads | Zeropoints | Mag plots | Spatial mag deviation | Spatial sky 16325A emission deviations (filled: sky, open: star) | Spatial sky continuum emission | Spatial sky telluric CO2 absorption deviations (filled: H < 10) | |||||||||||||||||||||||
| 0 | 0 |
|
|
|
|
|
|
| IPAIR | NAME | SHIFT | NEWSHIFT | S/N | NAME | SHIFT | NEWSHIFT | S/N |
| 0 | 10880012 | 0.492602 | 0.00000 | 188.770 | 10880013 | 0.000662015 | 0.491940 | 188.949 |
| 1 | 10880016 | 0.491363 | 0.00123900 | 211.653 | 10880017 | -0.000732089 | 0.493334 | 214.456 |
| 2 | 10880015 | 0.490135 | 0.00246698 | 210.790 | 10880014 | -0.000214429 | 0.492816 | 202.252 |
| 3 | 10880011 | 0.491544 | 0.00105798 | 202.975 | 10880010 | 0.00000 | 0.492602 | 191.796 |