| Red | Green | Blue | |
| z | 17.64 | ||
| znorm | Inf | ||
| sky | -Inf | -Inf | -Inf |
| S/N | 24.8 | 43.6 | 48.9 |
| S/N(c) | 0.0 | 0.0 | 0.0 |
| SN(E/C) |

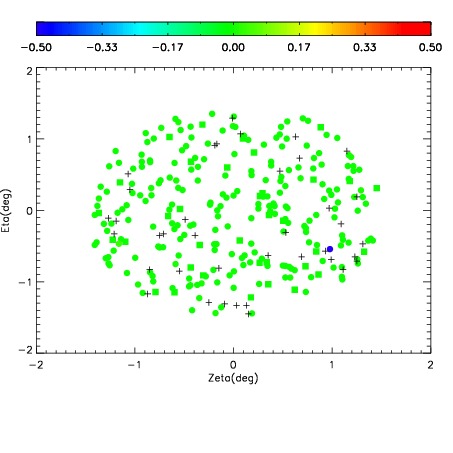
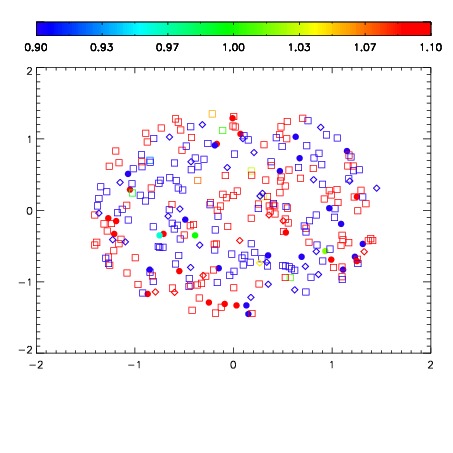
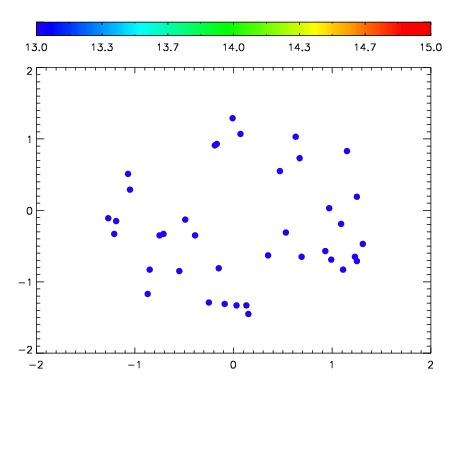

| Frame | Nreads | Zeropoints | Mag plots | Spatial mag deviation | Spatial sky 16325A emission deviations (filled: sky, open: star) | Spatial sky continuum emission | Spatial sky telluric CO2 absorption deviations (filled: H < 10) | |||||||||||||||||||||||
| 0 | 0 |
|
|
|
|
|
|
| IPAIR | NAME | SHIFT | NEWSHIFT | S/N | NAME | SHIFT | NEWSHIFT | S/N |
| 0 | 10820029 | 0.487567 | 0.00000 | 201.122 | 10820028 | -0.000896094 | 0.488463 | 197.224 |
| 1 | 10820025 | 0.485576 | 0.00199100 | 211.985 | 10820024 | 0.00000 | 0.487567 | 205.981 |
| 2 | 10820026 | 0.485842 | 0.00172502 | 207.169 | 10820031 | -0.00152440 | 0.489091 | 203.001 |
| 3 | 10820030 | 0.487533 | 3.40044e-05 | 201.404 | 10820027 | -0.000662640 | 0.488230 | 201.401 |