| Red | Green | Blue | |
| z | 17.64 | ||
| znorm | Inf | ||
| sky | -Inf | -NaN | -Inf |
| S/N | 25.1 | 40.7 | 45.5 |
| S/N(c) | 0.0 | 0.0 | 0.0 |
| SN(E/C) |


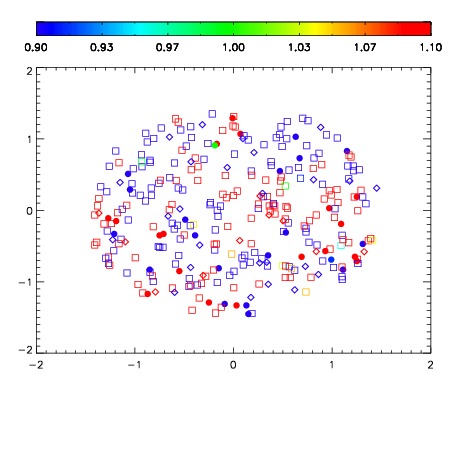


| Frame | Nreads | Zeropoints | Mag plots | Spatial mag deviation | Spatial sky 16325A emission deviations (filled: sky, open: star) | Spatial sky continuum emission | Spatial sky telluric CO2 absorption deviations (filled: H < 10) | |||||||||||||||||||||||
| 0 | 0 |
|
|
|
|
|
|
| IPAIR | NAME | SHIFT | NEWSHIFT | S/N | NAME | SHIFT | NEWSHIFT | S/N |
| 0 | 11040014 | 0.485078 | 0.00000 | 197.947 | 11040019 | -0.000350148 | 0.485428 | 200.943 |
| 1 | 11040013 | 0.484852 | 0.000226021 | 195.760 | 11040015 | 0.000149138 | 0.484929 | 200.077 |
| 2 | 11040018 | 0.482843 | 0.00223500 | 193.637 | 11040012 | 0.00000 | 0.485078 | 192.600 |
| 3 | 11040017 | 0.482767 | 0.00231102 | 174.358 | 11040016 | -0.000108409 | 0.485186 | 179.926 |