| Red | Green | Blue | |
| z | 17.64 | ||
| znorm | Inf | ||
| sky | -Inf | -Inf | -Inf |
| S/N | 25.1 | 41.8 | 48.0 |
| S/N(c) | 0.0 | 0.0 | 0.0 |
| SN(E/C) |
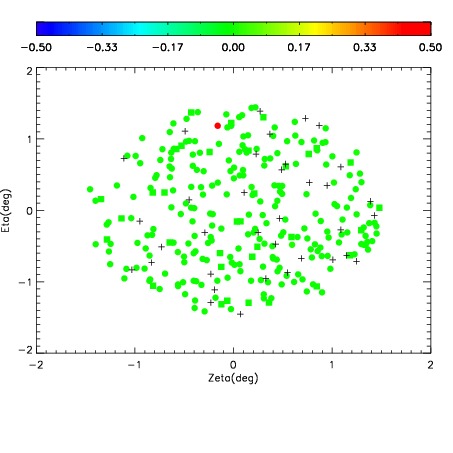
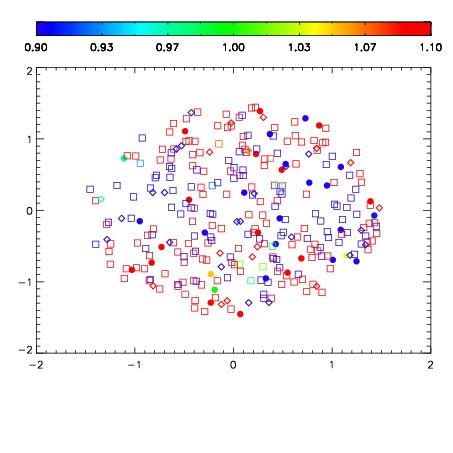
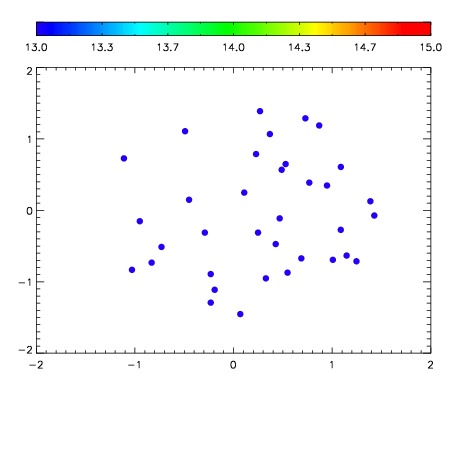

| Frame | Nreads | Zeropoints | Mag plots | Spatial mag deviation | Spatial sky 16325A emission deviations (filled: sky, open: star) | Spatial sky continuum emission | Spatial sky telluric CO2 absorption deviations (filled: H < 10) | |||||||||||||||||||||||
| 0 | 0 |
|
|
|
|
|
|
| IPAIR | NAME | SHIFT | NEWSHIFT | S/N | NAME | SHIFT | NEWSHIFT | S/N |
| 0 | 10790026 | 0.493191 | 0.00000 | 232.624 | 10790032 | -0.00137145 | 0.494562 | 233.555 |
| 1 | 10790031 | 0.491795 | 0.00139600 | 240.278 | 10790028 | -0.00264309 | 0.495834 | 239.186 |
| 2 | 10790030 | 0.491356 | 0.00183502 | 233.417 | 10790029 | -0.00257949 | 0.495770 | 239.179 |
| 3 | 10790027 | 0.493073 | 0.000118017 | 220.165 | 10790025 | 0.00000 | 0.493191 | 231.867 |