| Red | Green | Blue | |
| z | 17.64 | ||
| znorm | Inf | ||
| sky | -Inf | -Inf | -Inf |
| S/N | 28.8 | 49.0 | 54.1 |
| S/N(c) | 0.0 | 0.0 | 0.0 |
| SN(E/C) |
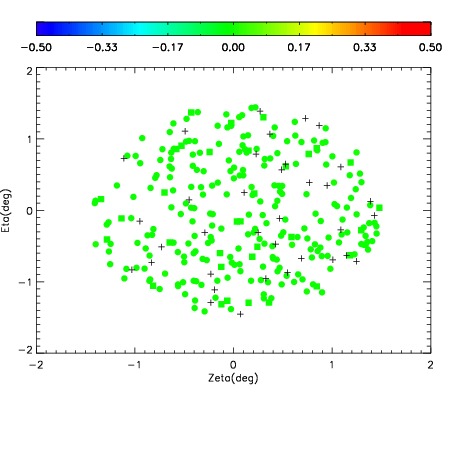
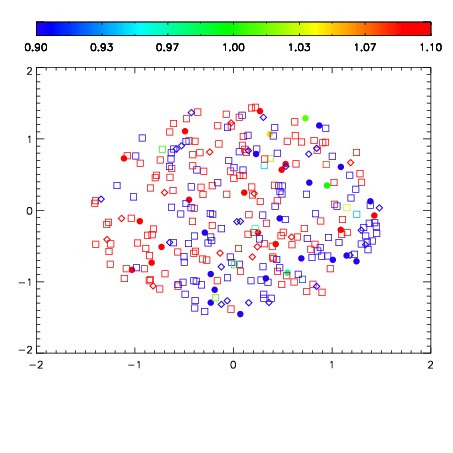
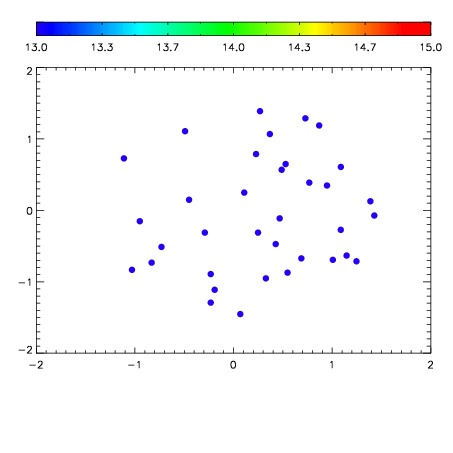

| Frame | Nreads | Zeropoints | Mag plots | Spatial mag deviation | Spatial sky 16325A emission deviations (filled: sky, open: star) | Spatial sky continuum emission | Spatial sky telluric CO2 absorption deviations (filled: H < 10) | |||||||||||||||||||||||
| 0 | 0 |
|
|
|
|
|
|
| IPAIR | NAME | SHIFT | NEWSHIFT | S/N | NAME | SHIFT | NEWSHIFT | S/N |
| 0 | 10840027 | 0.491877 | 0.00000 | 236.315 | 10840029 | -0.000290708 | 0.492168 | 237.262 |
| 1 | 10840031 | 0.490256 | 0.00162098 | 245.535 | 10840033 | 0.000301972 | 0.491575 | 245.179 |
| 2 | 10840032 | 0.490353 | 0.00152400 | 242.731 | 10840034 | 0.000296812 | 0.491580 | 244.220 |
| 3 | 10840028 | 0.491833 | 4.39882e-05 | 239.206 | 10840030 | -0.000282424 | 0.492159 | 244.136 |
| 4 | 10840035 | 0.490682 | 0.00119498 | 231.099 | 10840026 | 0.00000 | 0.491877 | 229.744 |