| Red | Green | Blue | |
| z | 17.64 | ||
| znorm | Inf | ||
| sky | -Inf | -Inf | -Inf |
| S/N | 20.2 | 34.9 | 39.2 |
| S/N(c) | 0.0 | 0.0 | 0.0 |
| SN(E/C) |

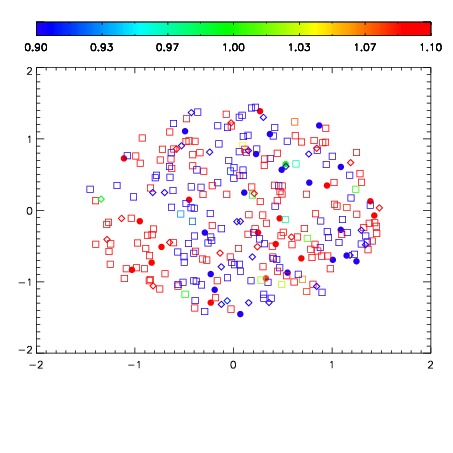
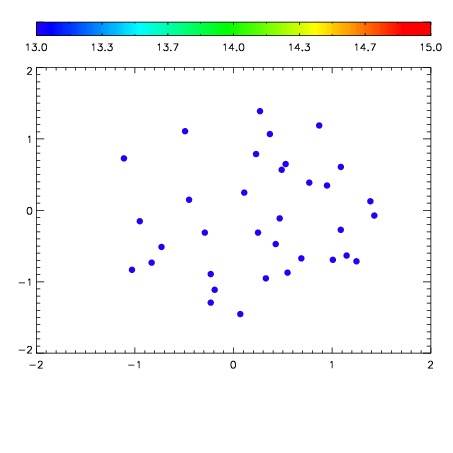

| Frame | Nreads | Zeropoints | Mag plots | Spatial mag deviation | Spatial sky 16325A emission deviations (filled: sky, open: star) | Spatial sky continuum emission | Spatial sky telluric CO2 absorption deviations (filled: H < 10) | |||||||||||||||||||||||
| 0 | 0 |
|
|
|
|
|
|
| IPAIR | NAME | SHIFT | NEWSHIFT | S/N | NAME | SHIFT | NEWSHIFT | S/N |
| 0 | 11060013 | 0.481276 | 0.00000 | 180.704 | 11060011 | 0.00000 | 0.481276 | 182.932 |
| 1 | 11060017 | 0.479387 | 0.00188902 | 223.830 | 11060015 | -0.00282542 | 0.484101 | 207.884 |
| 2 | 11060016 | 0.479147 | 0.00212902 | 202.815 | 11060014 | -0.00193277 | 0.483209 | 207.538 |
| 3 | 11060012 | 0.481217 | 5.90086e-05 | 190.349 | 11060018 | -0.00160984 | 0.482886 | 202.663 |