| Red | Green | Blue | |
| z | 17.64 | ||
| znorm | Inf | ||
| sky | -Inf | -Inf | -Inf |
| S/N | 14.4 | 25.7 | 28.1 |
| S/N(c) | 0.0 | 0.0 | 0.0 |
| SN(E/C) |
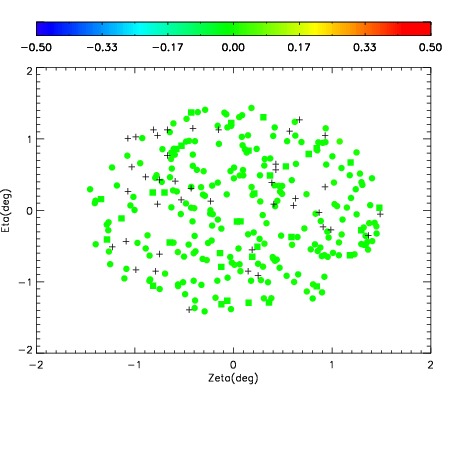
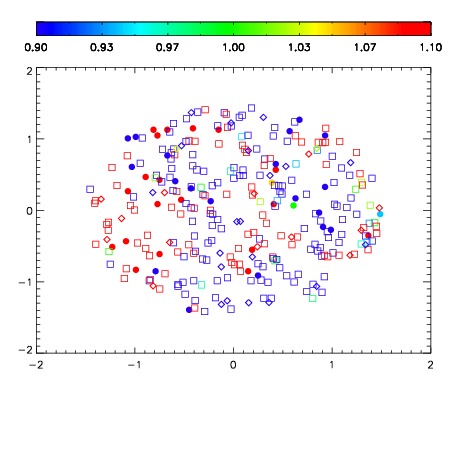
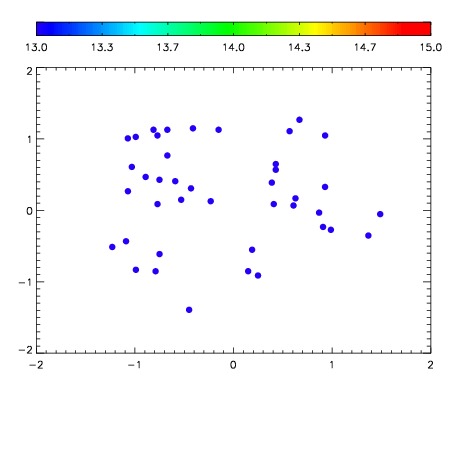

| Frame | Nreads | Zeropoints | Mag plots | Spatial mag deviation | Spatial sky 16325A emission deviations (filled: sky, open: star) | Spatial sky continuum emission | Spatial sky telluric CO2 absorption deviations (filled: H < 10) | |||||||||||||||||||||||
| 0 | 0 |
|
|
|
|
|
|
| IPAIR | NAME | SHIFT | NEWSHIFT | S/N | NAME | SHIFT | NEWSHIFT | S/N |
| 0 | 11080013 | 0.480914 | 0.00000 | 148.449 | 11080014 | -0.00209513 | 0.483009 | 146.808 |
| 1 | 11080012 | 0.480184 | 0.000730008 | 154.625 | 11080011 | 0.00000 | 0.480914 | 160.352 |
| 2 | 11080016 | 0.476971 | 0.00394300 | 148.955 | 11080015 | -0.00191832 | 0.482832 | 155.728 |
| 3 | 11080017 | 0.477997 | 0.00291699 | 138.046 | 11080018 | -0.00299337 | 0.483907 | 139.559 |