| Red | Green | Blue | |
| z | 17.64 | ||
| znorm | Inf | ||
| sky | -Inf | -Inf | -Inf |
| S/N | 30.2 | 53.7 | 57.5 |
| S/N(c) | 0.0 | 0.0 | 0.0 |
| SN(E/C) |

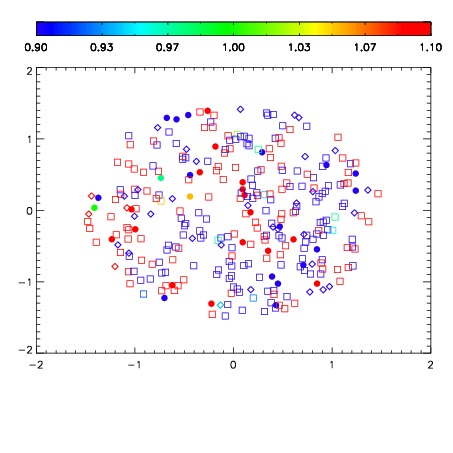
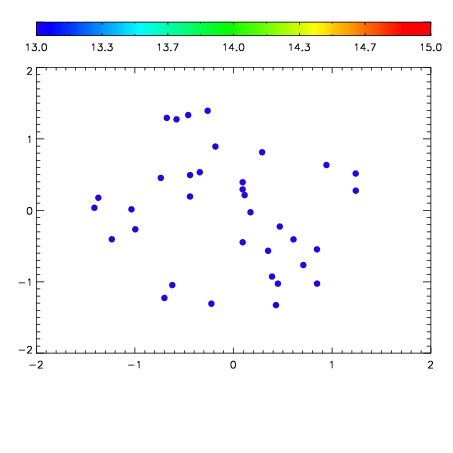

| Frame | Nreads | Zeropoints | Mag plots | Spatial mag deviation | Spatial sky 16325A emission deviations (filled: sky, open: star) | Spatial sky continuum emission | Spatial sky telluric CO2 absorption deviations (filled: H < 10) | |||||||||||||||||||||||
| 0 | 0 |
|
|
|
|
|
|
| IPAIR | NAME | SHIFT | NEWSHIFT | S/N | NAME | SHIFT | NEWSHIFT | S/N |
| 0 | 10250079 | 0.494554 | 0.00000 | 218.182 | 10250078 | 0.00162261 | 0.492931 | 217.591 |
| 1 | 10250076 | 0.492371 | 0.00218302 | 211.697 | 10250074 | 0.000536699 | 0.494017 | 212.124 |
| 2 | 10250075 | 0.492089 | 0.00246501 | 204.283 | 10250077 | 0.00212738 | 0.492427 | 208.044 |
| 3 | 10250072 | 0.493212 | 0.00134200 | 199.735 | 10250073 | 0.00127158 | 0.493282 | 204.138 |
| 4 | 10250071 | 0.492422 | 0.00213200 | 199.364 | 10250070 | 0.00000 | 0.494554 | 197.956 |