| Red | Green | Blue | |
| z | 17.64 | ||
| znorm | Inf | ||
| sky | -NaN | -Inf | -Inf |
| S/N | 26.3 | 46.5 | 50.9 |
| S/N(c) | 0.0 | 0.0 | 0.0 |
| SN(E/C) |

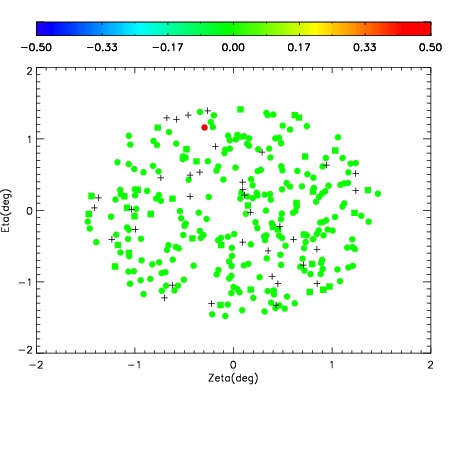
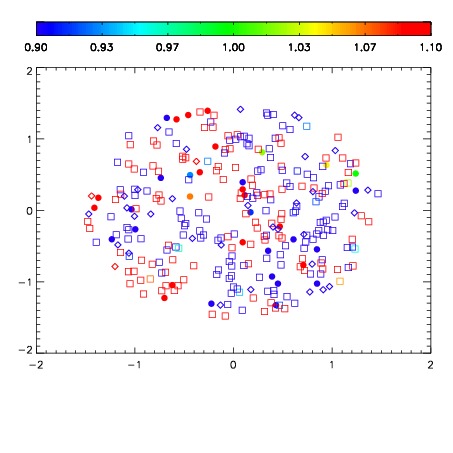
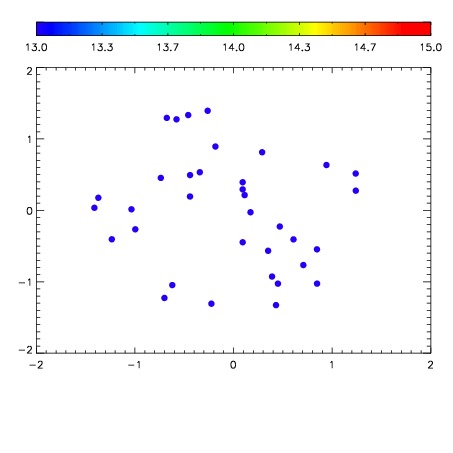

| Frame | Nreads | Zeropoints | Mag plots | Spatial mag deviation | Spatial sky 16325A emission deviations (filled: sky, open: star) | Spatial sky continuum emission | Spatial sky telluric CO2 absorption deviations (filled: H < 10) | |||||||||||||||||||||||
| 0 | 0 |
|
|
|
|
|
|
| IPAIR | NAME | SHIFT | NEWSHIFT | S/N | NAME | SHIFT | NEWSHIFT | S/N |
| 0 | 10540061 | 0.500159 | 0.00000 | 226.292 | 10540062 | 0.00417122 | 0.495988 | 234.604 |
| 1 | 10540065 | 0.499810 | 0.000349015 | 238.020 | 10540066 | 0.00373668 | 0.496422 | 239.334 |
| 2 | 10540064 | 0.498892 | 0.00126702 | 233.865 | 10540063 | 0.00411527 | 0.496044 | 234.979 |
| 3 | 10540060 | 0.499909 | 0.000250012 | 152.556 | 10540059 | 0.00000 | 0.500159 | 177.204 |