| Red | Green | Blue | |
| z | 17.64 | ||
| znorm | Inf | ||
| sky | -NaN | -Inf | -Inf |
| S/N | 29.5 | 51.0 | 56.8 |
| S/N(c) | 0.0 | 0.0 | 0.0 |
| SN(E/C) |
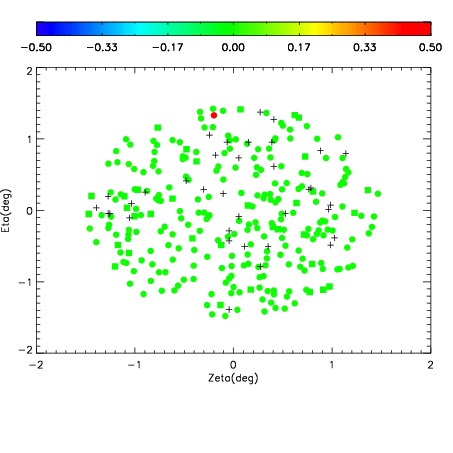
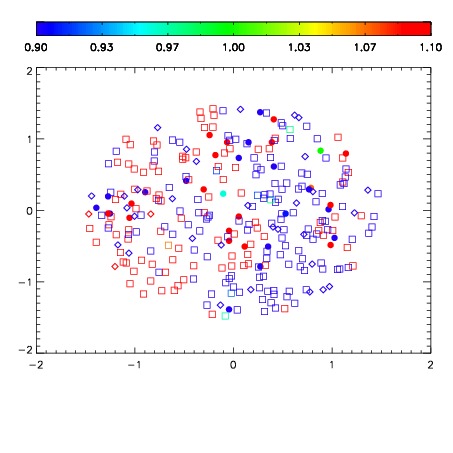
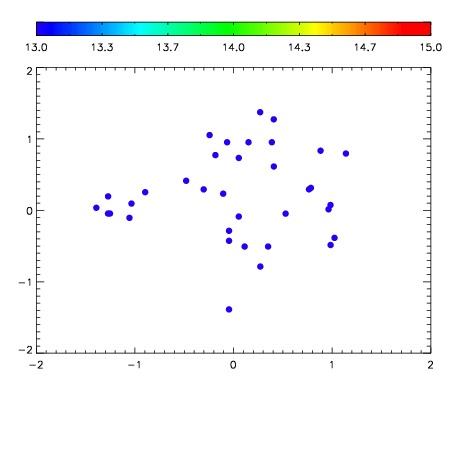

| Frame | Nreads | Zeropoints | Mag plots | Spatial mag deviation | Spatial sky 16325A emission deviations (filled: sky, open: star) | Spatial sky continuum emission | Spatial sky telluric CO2 absorption deviations (filled: H < 10) | |||||||||||||||||||||||
| 0 | 0 |
|
|
|
|
|
|
| IPAIR | NAME | SHIFT | NEWSHIFT | S/N | NAME | SHIFT | NEWSHIFT | S/N |
| 0 | 10260071 | 0.491094 | 0.00000 | 223.101 | 10260072 | -0.000425717 | 0.491520 | 219.277 |
| 1 | 10260075 | 0.490684 | 0.000409991 | 225.504 | 10260073 | 4.60669e-05 | 0.491048 | 224.242 |
| 2 | 10260074 | 0.489798 | 0.00129598 | 223.869 | 10260076 | -0.000777524 | 0.491872 | 223.053 |
| 3 | 10260070 | 0.490676 | 0.000418007 | 219.700 | 10260069 | 0.00000 | 0.491094 | 215.925 |