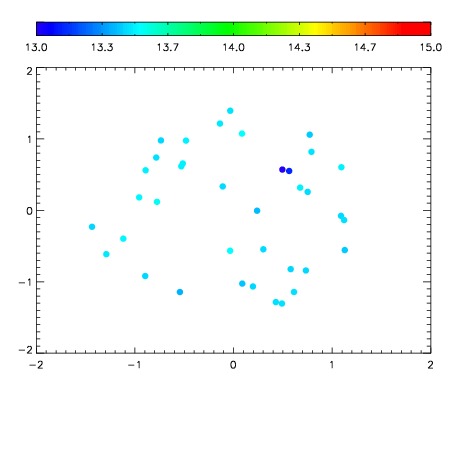
| Frame | Nreads | Zeropoints | Mag plots
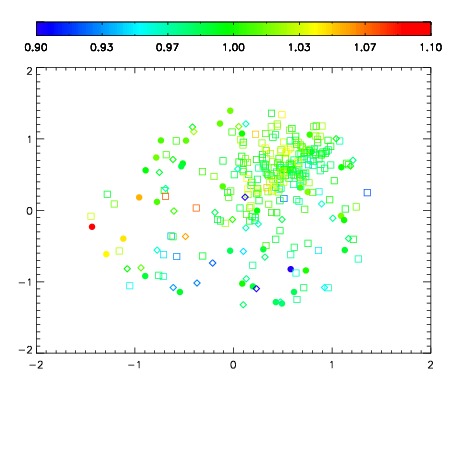
| Spatial mag deviation
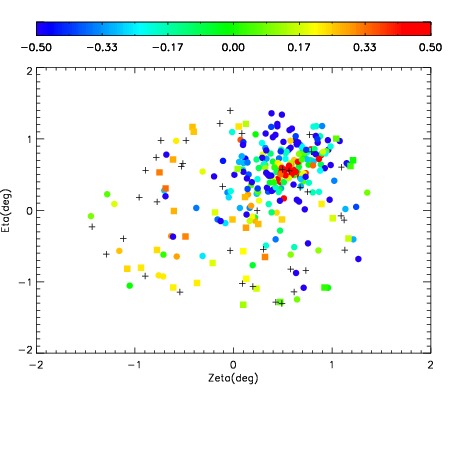
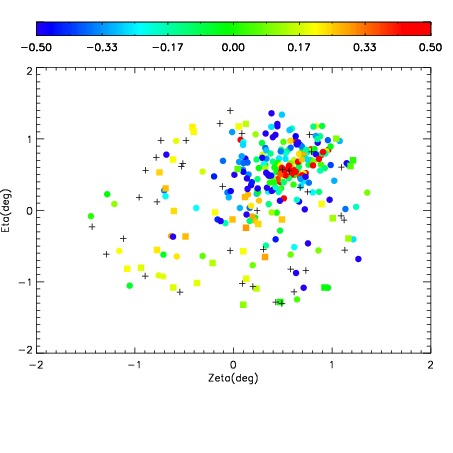
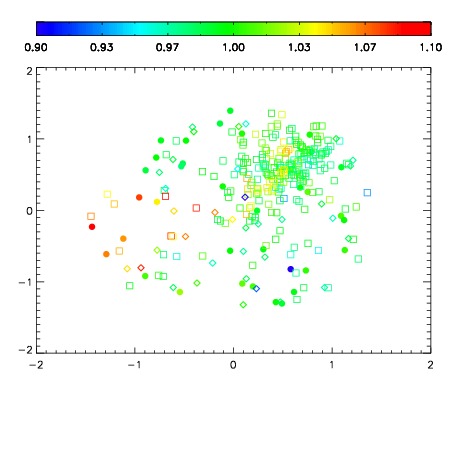
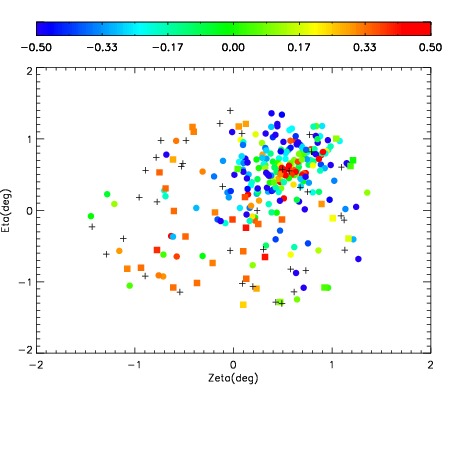
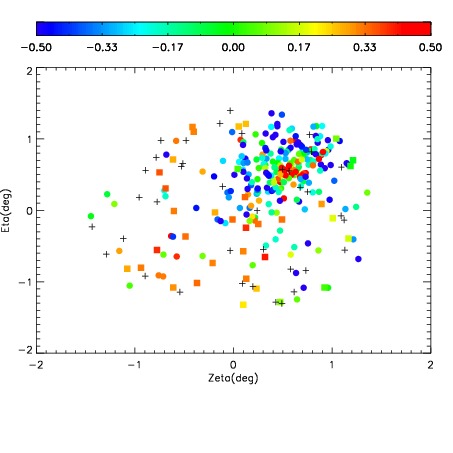
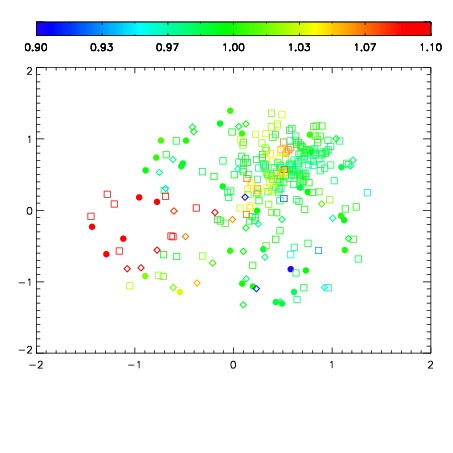
| Spatial sky 16325A emission deviations (filled: sky, open: star)
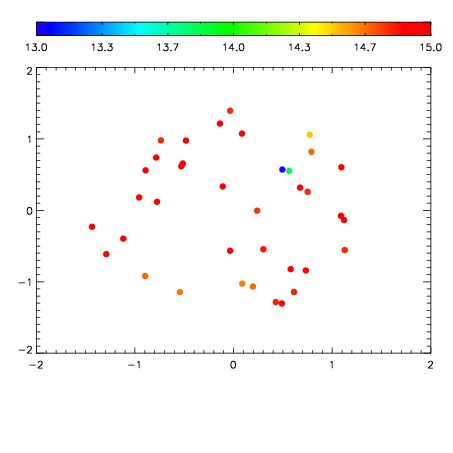
| Spatial sky continuum emission
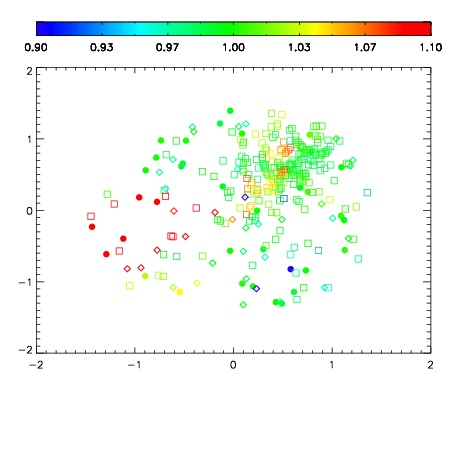
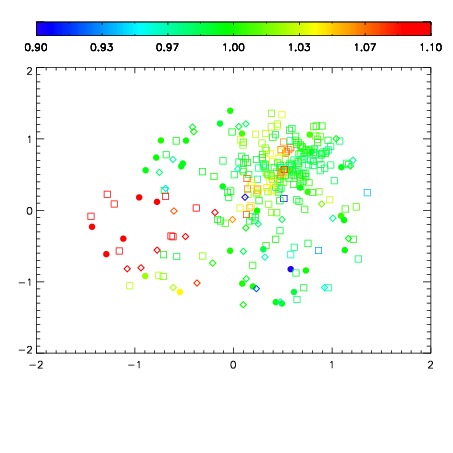
| Spatial sky telluric CO2 absorption deviations (filled: H < 10)
|
| 11100011
| 47
| | Red | Green | Blue
| | z | | 18.13
| | znorm | | 13.95
| | sky | 13.8 | 13.5 | 13.1
| | S/N | 46.2 | 58.8 | 63.4
| | S/N(c) | 44.8 | 57.5 | 61.7
| | SN(E/C) 0.89
|
| 
| 
| 
| 
| 
|
| 11100012
| 47
| | Red | Green | Blue
| | z | | 18.26
| | znorm | | 14.08
| | sky | 14.9 | 14.6 | 14.6
| | S/N | 47.3 | 61.9 | 67.8
| | S/N(c) | 45.9 | 60.7 | 65.7
| | SN(E/C) 0.93
|
| 
| 
| 
| 
| 
|
| 11100013
| 47
| | Red | Green | Blue
| | z | | 18.35
| | znorm | | 14.17
| | sky | 15.0 | 14.9 | 15.0
| | S/N | 48.4 | 63.6 | 70.7
| | S/N(c) | 46.8 | 62.5 | 68.6
| | SN(E/C) 0.95
|
| 
| 
| 
| 
| 
|
| 11100014
| 47
| | Red | Green | Blue
| | z | | 18.54
| | znorm | | 14.36
| | sky | 14.9 | 14.8 | 15.0
| | S/N | 51.3 | 67.3 | 75.7
| | S/N(c) | 49.5 | 66.2 | 73.5
| | SN(E/C) 0.88
|
| 
| 
| 
| 
| 
|
| 11100015
| 47
| | Red | Green | Blue
| | z | | 18.55
| | znorm | | 14.36
| | sky | 15.0 | 14.9 | 14.8
| | S/N | 51.6 | 67.9 | 77.1
| | S/N(c) | 49.9 | 66.8 | 75.0
| | SN(E/C) 0.90
|
| 
| 
| 
| 
| 
|
| 11100016
| 47
| | Red | Green | Blue
| | z | | 18.60
| | znorm | | 14.42
| | sky | 15.4 | 15.1 | 14.9
| | S/N | 52.0 | 68.7 | 78.3
| | S/N(c) | 50.4 | 67.6 | 76.3
| | SN(E/C) 0.87
|
| 
| 
| 
| 
| 
|
| 11100017
| 47
| | Red | Green | Blue
| | z | | 18.46
| | znorm | | 14.28
| | sky | 15.1 | 15.0 | 15.2
| | S/N | 50.4 | 66.7 | 76.6
| | S/N(c) | 48.8 | 65.7 | 74.8
| | SN(E/C) 0.89
|
| 
| 
| 
| 
| 
|
| 11100018
| 47
| | Red | Green | Blue
| | z | | 18.54
| | znorm | | 14.36
| | sky | 15.1 | 14.9 | 15.2
| | S/N | 51.1 | 67.5 | 77.6
| | S/N(c) | 49.4 | 66.3 | 75.8
| | SN(E/C) 0.88
|
| 
| 
| 
| 
| 
|