| Red | Green | Blue | |
| z | 17.65 | ||
| znorm | Inf | ||
| sky | -Inf | -Inf | -Inf |
| S/N | 96.1 | 128.2 | 142.7 |
| S/N(c) | 0.0 | 0.0 | 0.0 |
| SN(E/C) |

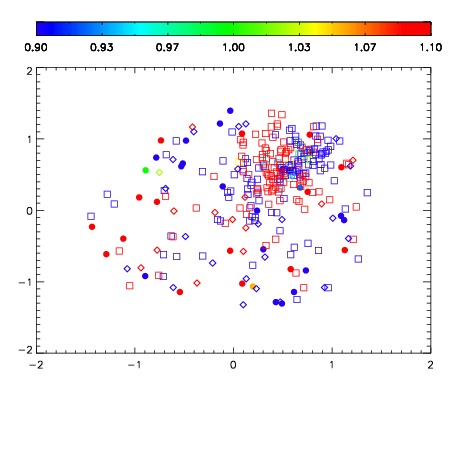
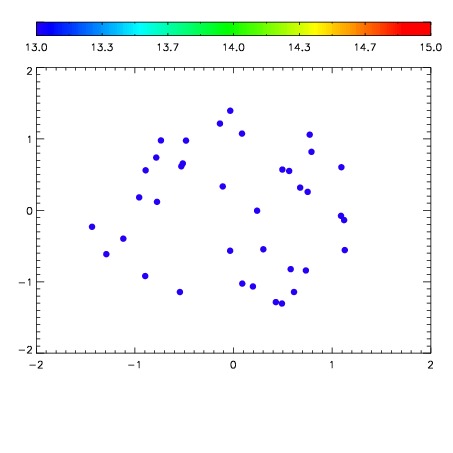

| Frame | Nreads | Zeropoints | Mag plots | Spatial mag deviation | Spatial sky 16325A emission deviations (filled: sky, open: star) | Spatial sky continuum emission | Spatial sky telluric CO2 absorption deviations (filled: H < 10) | |||||||||||||||||||||||
| 0 | 0 |
|
|
|
|
|
|
| IPAIR | NAME | SHIFT | NEWSHIFT | S/N | NAME | SHIFT | NEWSHIFT | S/N |
| 0 | 11100012 | 0.473825 | 0.00000 | 144.225 | 11100011 | 0.00000 | 0.473825 | 136.496 |
| 1 | 11100016 | 0.472871 | 0.000954002 | 182.917 | 11100015 | -0.00330148 | 0.477126 | 178.769 |
| 2 | 11100017 | 0.472824 | 0.00100100 | 169.064 | 11100018 | -0.00239757 | 0.476223 | 177.591 |
| 3 | 11100013 | 0.472825 | 0.00100002 | 154.366 | 11100014 | -0.00313924 | 0.476964 | 176.037 |