| Red | Green | Blue | |
| z | 17.66 | ||
| znorm | Inf | ||
| sky | -Inf | -Inf | -Inf |
| S/N | 23.9 | 44.1 | 46.5 |
| S/N(c) | 0.0 | 0.0 | 0.0 |
| SN(E/C) |
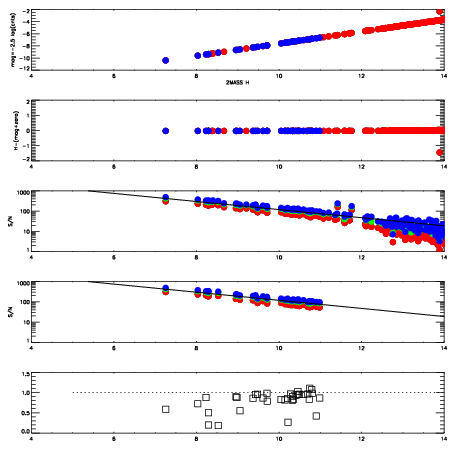
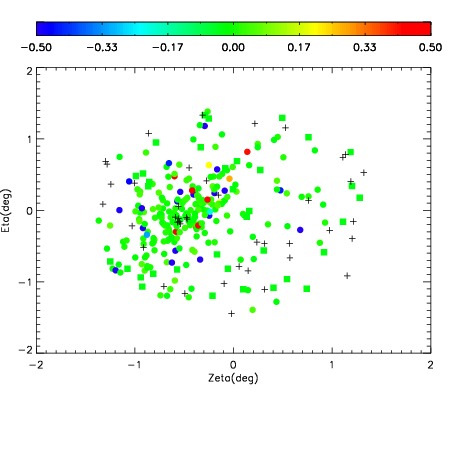
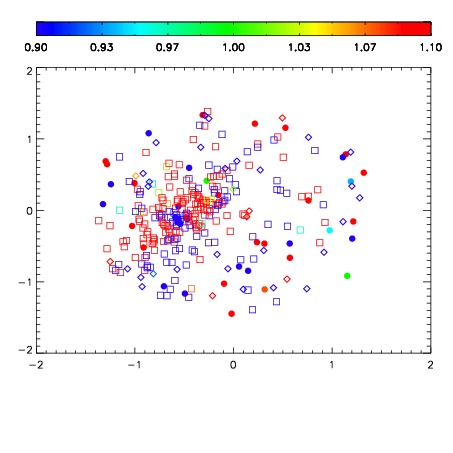
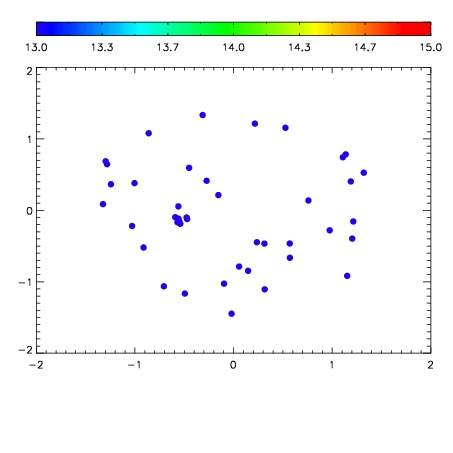

| Frame | Nreads | Zeropoints | Mag plots | Spatial mag deviation | Spatial sky 16325A emission deviations (filled: sky, open: star) | Spatial sky continuum emission | Spatial sky telluric CO2 absorption deviations (filled: H < 10) | |||||||||||||||||||||||
| 0 | 0 |
|
|
|
|
|
|
| IPAIR | NAME | SHIFT | NEWSHIFT | S/N | NAME | SHIFT | NEWSHIFT | S/N |
| 0 | 10490067 | 0.502600 | 0.00000 | 175.733 | 10490064 | 0.00168641 | 0.500914 | 169.395 |
| 1 | 10490063 | 0.501481 | 0.00111902 | 173.396 | 10490068 | 0.00521499 | 0.497385 | 166.263 |
| 2 | 10490062 | 0.500891 | 0.00170904 | 168.001 | 10490061 | 0.00000 | 0.502600 | 163.620 |
| 3 | 10490066 | 0.502422 | 0.000178039 | 164.696 | 10490065 | 0.00186052 | 0.500740 | 163.442 |