| Red | Green | Blue | |
| z | 17.66 | ||
| znorm | Inf | ||
| sky | -Inf | -Inf | -Inf |
| S/N | 23.4 | 43.9 | 49.1 |
| S/N(c) | 0.0 | 0.0 | 0.0 |
| SN(E/C) |

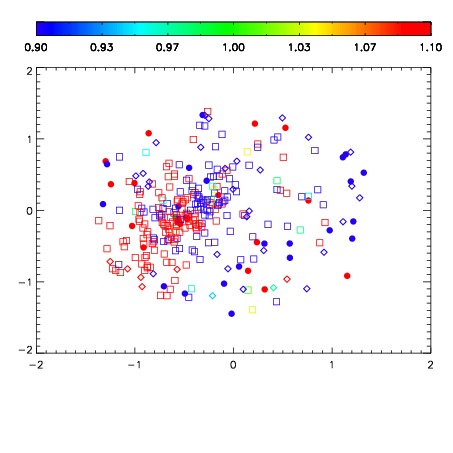


| Frame | Nreads | Zeropoints | Mag plots | Spatial mag deviation | Spatial sky 16325A emission deviations (filled: sky, open: star) | Spatial sky continuum emission | Spatial sky telluric CO2 absorption deviations (filled: H < 10) | |||||||||||||||||||||||
| 0 | 0 |
|
|
|
|
|
|
| IPAIR | NAME | SHIFT | NEWSHIFT | S/N | NAME | SHIFT | NEWSHIFT | S/N |
| 0 | 10840041 | 0.491914 | 0.00000 | 156.232 | 10840039 | 0.00000 | 0.491914 | 160.421 |
| 1 | 10840044 | 0.487499 | 0.00441501 | 160.337 | 10840043 | -0.00145942 | 0.493373 | 163.631 |
| 2 | 10840045 | 0.488096 | 0.00381801 | 159.472 | 10840046 | -0.00147349 | 0.493387 | 160.908 |
| 3 | 10840040 | 0.491814 | 0.000100017 | 153.083 | 10840042 | -0.00108484 | 0.492999 | 158.393 |