| Red | Green | Blue | |
| z | 17.64 | ||
| znorm | Inf | ||
| sky | -NaN | -Inf | -Inf |
| S/N | 21.7 | 38.6 | 37.9 |
| S/N(c) | 0.0 | 0.0 | 0.0 |
| SN(E/C) |
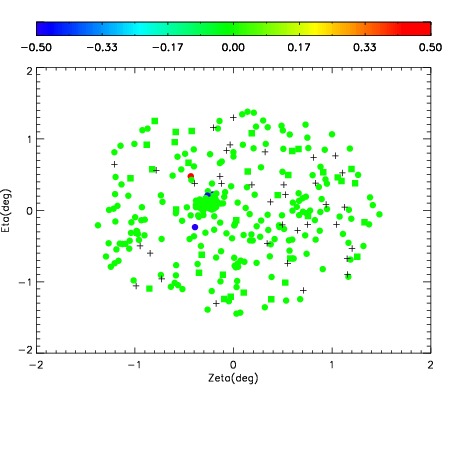
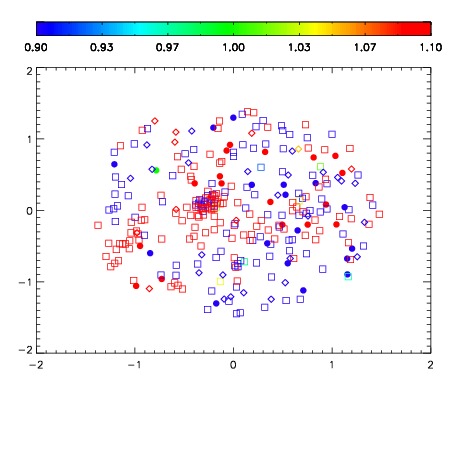
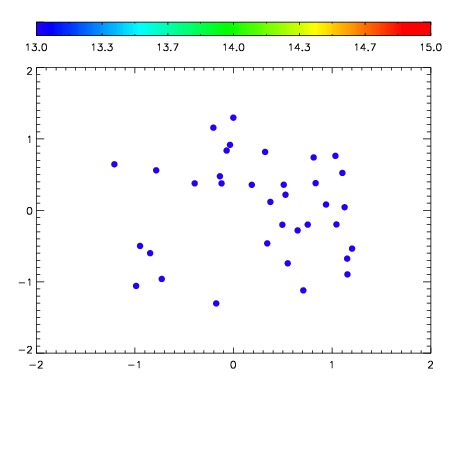

| Frame | Nreads | Zeropoints | Mag plots | Spatial mag deviation | Spatial sky 16325A emission deviations (filled: sky, open: star) | Spatial sky continuum emission | Spatial sky telluric CO2 absorption deviations (filled: H < 10) | |||||||||||||||||||||||
| 0 | 0 |
|
|
|
|
|
|
| IPAIR | NAME | SHIFT | NEWSHIFT | S/N | NAME | SHIFT | NEWSHIFT | S/N |
| 0 | 11090013 | 0.479731 | 0.00000 | 205.048 | 11090015 | -0.00299310 | 0.482724 | 211.151 |
| 1 | 11090017 | 0.478200 | 0.00153100 | 210.404 | 11090016 | -0.00231406 | 0.482045 | 225.514 |
| 2 | 11090014 | 0.479657 | 7.39992e-05 | 201.208 | 11090012 | 0.00000 | 0.479731 | 207.043 |
| 3 | 11090018 | 0.479062 | 0.000669003 | 196.549 | 11090019 | -0.00135894 | 0.481090 | 201.690 |