| Red | Green | Blue | |
| z | 17.64 | ||
| znorm | Inf | ||
| sky | -NaN | -NaN | -Inf |
| S/N | 22.3 | 39.2 | 41.3 |
| S/N(c) | 0.0 | 0.0 | 0.0 |
| SN(E/C) |
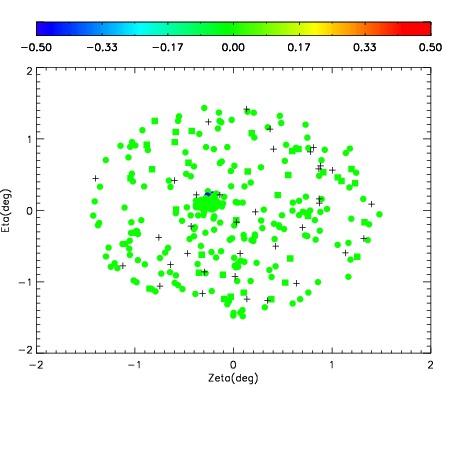
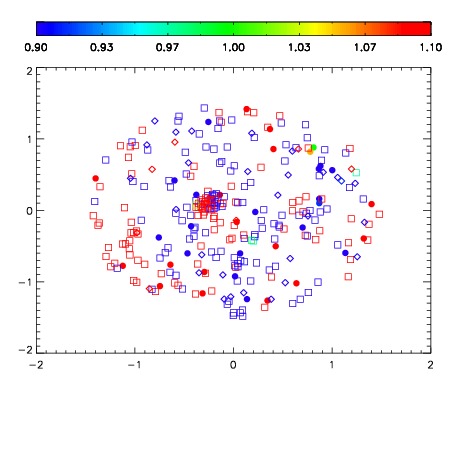
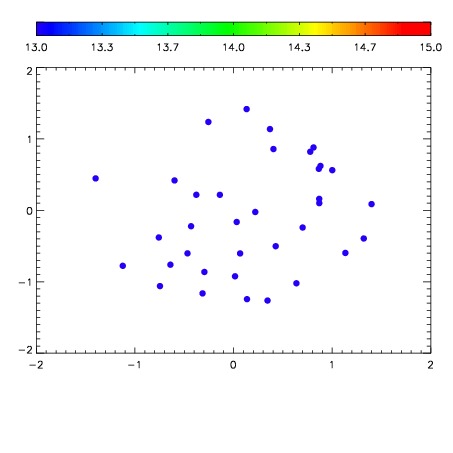

| Frame | Nreads | Zeropoints | Mag plots | Spatial mag deviation | Spatial sky 16325A emission deviations (filled: sky, open: star) | Spatial sky continuum emission | Spatial sky telluric CO2 absorption deviations (filled: H < 10) | |||||||||||||||||||||||
| 0 | 0 |
|
|
|
|
|
|
| IPAIR | NAME | SHIFT | NEWSHIFT | S/N | NAME | SHIFT | NEWSHIFT | S/N |
| 0 | 11120013 | 0.477958 | 0.00000 | 215.810 | 11120014 | -0.00435091 | 0.482309 | 219.343 |
| 1 | 11120016 | 0.476527 | 0.00143099 | 224.723 | 11120018 | -0.00366640 | 0.481624 | 226.249 |
| 2 | 11120012 | 0.477103 | 0.000854999 | 223.885 | 11120015 | -0.00466470 | 0.482623 | 223.417 |
| 3 | 11120017 | 0.476977 | 0.000981003 | 221.845 | 11120011 | 0.00000 | 0.477958 | 222.489 |