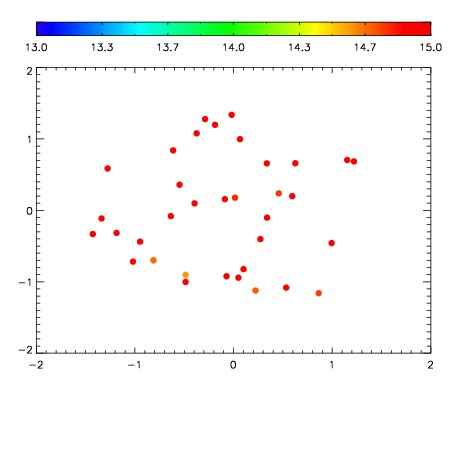
| Frame | Nreads | Zeropoints | Mag plots
| Spatial mag deviation
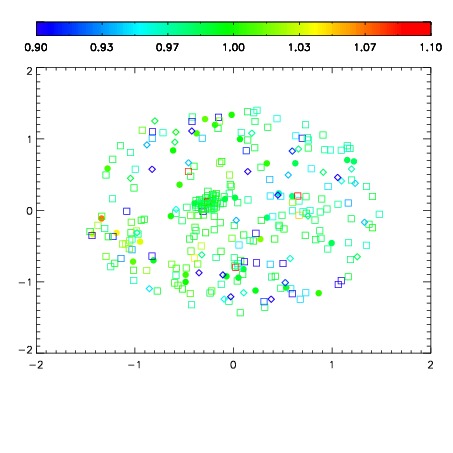
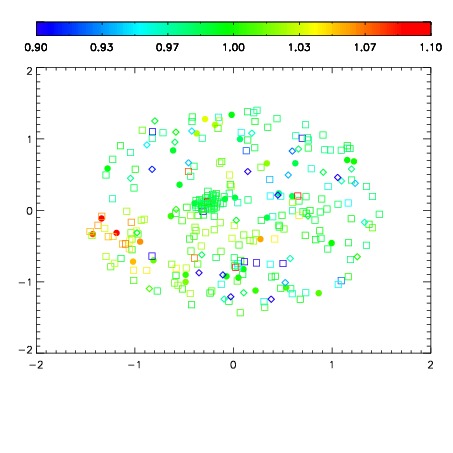
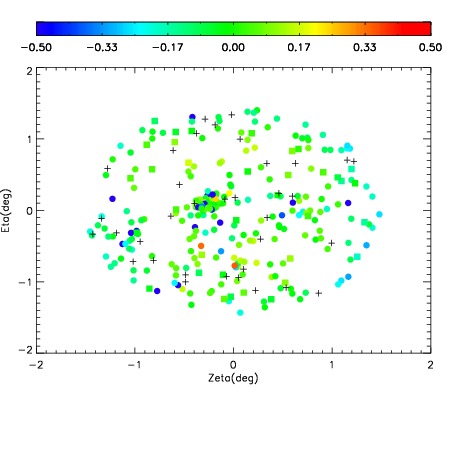
| Spatial sky 16325A emission deviations (filled: sky, open: star)
| Spatial sky continuum emission
| Spatial sky telluric CO2 absorption deviations (filled: H < 10)
|
| 10010181
| 47
| | Red | Green | Blue
| | z | | 18.73
| | znorm | | 14.55
| | sky | 15.1 | 15.0 | 14.6
| | S/N | 12.6 | 19.8 | 18.8
| | S/N(c) | 11.0 | 18.8 | 17.7
| | SN(E/C) 0.54
|
| 
| 
| 
| 
| 
|
| 10010182
| 47
| | Red | Green | Blue
| | z | | 18.65
| | znorm | | 14.47
| | sky | 15.2 | 15.0 | 15.2
| | S/N | 11.7 | 19.0 | 18.1
| | S/N(c) | 10.3 | 17.7 | 16.9
| | SN(E/C) 0.55
|
| 
| 
| 
| 
| 
|
| 10010183
| 47
| | Red | Green | Blue
| | z | | 18.78
| | znorm | | 14.60
| | sky | 14.9 | 14.9 | 15.2
| | S/N | 12.7 | 20.1 | 19.5
| | S/N(c) | 11.3 | 18.9 | 18.3
| | SN(E/C) 0.54
|
| 
| 
| 
| 
| 
|
| 10010184
| 47
| | Red | Green | Blue
| | z | | 18.75
| | znorm | | 14.57
| | sky | 15.0 | 15.1 | 15.1
| | S/N | 12.5 | 19.9 | 19.5
| | S/N(c) | 11.1 | 18.5 | 18.2
| | SN(E/C) 0.56
|
| 
| 
| 
| 
| 
|