| Red | Green | Blue | |
| z | 17.64 | ||
| znorm | Inf | ||
| sky | -Inf | -Inf | -Inf |
| S/N | 31.0 | 48.8 | 48.3 |
| S/N(c) | 0.0 | 0.0 | 0.0 |
| SN(E/C) |
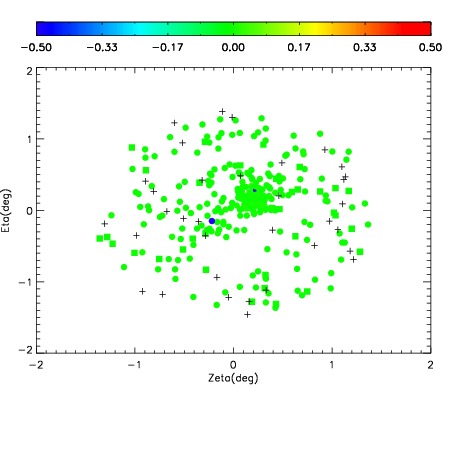
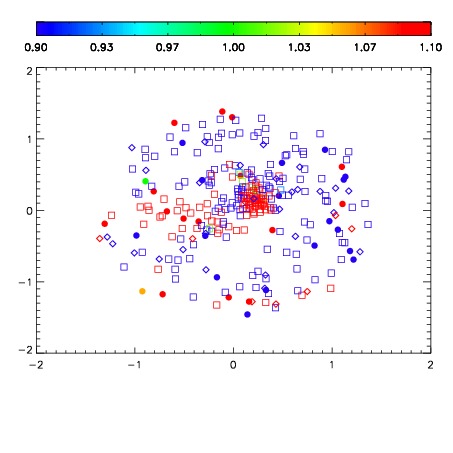
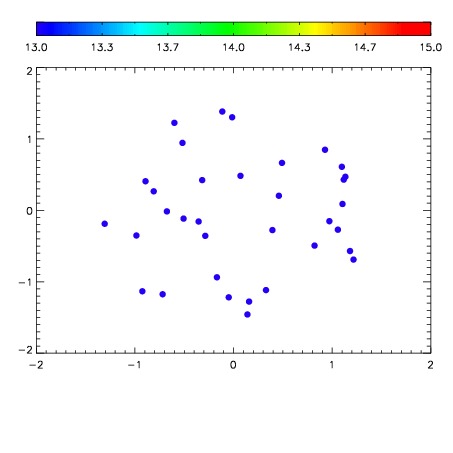

| Frame | Nreads | Zeropoints | Mag plots | Spatial mag deviation | Spatial sky 16325A emission deviations (filled: sky, open: star) | Spatial sky continuum emission | Spatial sky telluric CO2 absorption deviations (filled: H < 10) | |||||||||||||||||||||||
| 0 | 0 |
|
|
|
|
|
|
| IPAIR | NAME | SHIFT | NEWSHIFT | S/N | NAME | SHIFT | NEWSHIFT | S/N |
| 0 | 11070024 | 0.477926 | 0.00000 | 224.774 | 11070029 | 9.10647e-06 | 0.477917 | 228.866 |
| 1 | 11070023 | 0.477284 | 0.000641972 | 223.992 | 11070022 | 0.00000 | 0.477926 | 223.125 |
| 2 | 11070028 | 0.477868 | 5.79953e-05 | 222.483 | 11070026 | 0.00158039 | 0.476346 | 222.997 |
| 3 | 11070027 | 0.477912 | 1.39773e-05 | 219.139 | 11070025 | 0.00147686 | 0.476449 | 218.570 |