| Red | Green | Blue | |
| z | 17.64 | ||
| znorm | Inf | ||
| sky | -Inf | -Inf | -Inf |
| S/N | 23.8 | 37.9 | 38.2 |
| S/N(c) | 0.0 | 0.0 | 0.0 |
| SN(E/C) |
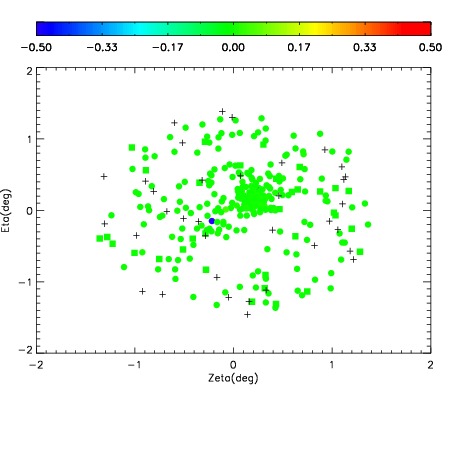
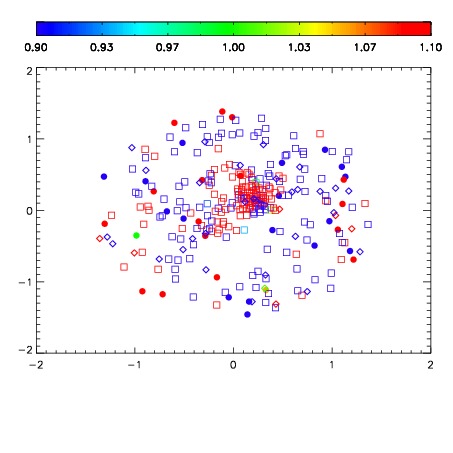
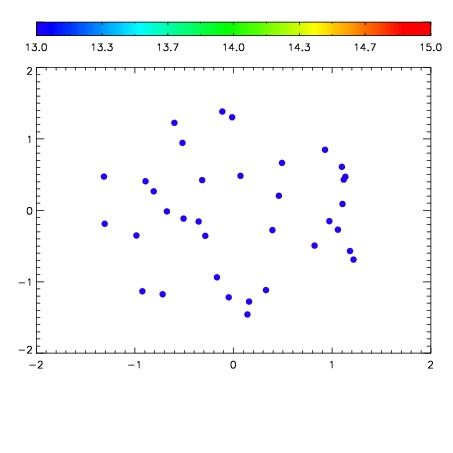

| Frame | Nreads | Zeropoints | Mag plots | Spatial mag deviation | Spatial sky 16325A emission deviations (filled: sky, open: star) | Spatial sky continuum emission | Spatial sky telluric CO2 absorption deviations (filled: H < 10) | |||||||||||||||||||||||
| 0 | 0 |
|
|
|
|
|
|
| IPAIR | NAME | SHIFT | NEWSHIFT | S/N | NAME | SHIFT | NEWSHIFT | S/N |
| 0 | 11110013 | 0.474076 | 0.00000 | 189.038 | 11110018 | -0.00135660 | 0.475433 | 183.706 |
| 1 | 11110012 | 0.473678 | 0.000398010 | 192.095 | 11110011 | 0.00000 | 0.474076 | 197.176 |
| 2 | 11110017 | 0.473666 | 0.000409991 | 177.680 | 11110014 | -0.00430789 | 0.478384 | 179.572 |
| 3 | 11110016 | 0.473894 | 0.000182003 | 173.498 | 11110015 | -0.00423141 | 0.478307 | 172.661 |