| Red | Green | Blue | |
| z | 17.64 | ||
| znorm | Inf | ||
| sky | -Inf | -NaN | -Inf |
| S/N | 30.1 | 47.9 | 46.9 |
| S/N(c) | 0.0 | 0.0 | 0.0 |
| SN(E/C) |
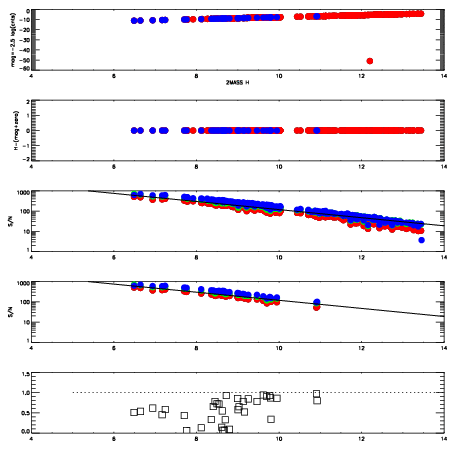

| Frame | Nreads | Zeropoints | Mag plots | Spatial mag deviation | Spatial sky 16325A emission deviations (filled: sky, open: star) | Spatial sky continuum emission | Spatial sky telluric CO2 absorption deviations (filled: H < 10) | |||||||||||||||||||||||
| 0 | 0 |
|
|
|
|
|
|
| IPAIR | NAME | SHIFT | NEWSHIFT | S/N | NAME | SHIFT | NEWSHIFT | S/N |
| 0 | 11390012 | 0.471199 | 0.00000 | 216.907 | 11390015 | -0.00157304 | 0.472772 | 220.336 |
| 1 | 11390017 | 0.469658 | 0.00154102 | 230.909 | 11390014 | -0.00215862 | 0.473358 | 236.894 |
| 2 | 11390016 | 0.469422 | 0.00177699 | 225.896 | 11390018 | 0.000823982 | 0.470375 | 229.089 |
| 3 | 11390013 | 0.471061 | 0.000138015 | 223.390 | 11390011 | 0.00000 | 0.471199 | 228.917 |