| Red | Green | Blue | |
| z | 17.64 | ||
| znorm | Inf | ||
| sky | -Inf | -Inf | -Inf |
| S/N | 29.4 | 46.3 | 45.5 |
| S/N(c) | 0.0 | 0.0 | 0.0 |
| SN(E/C) |

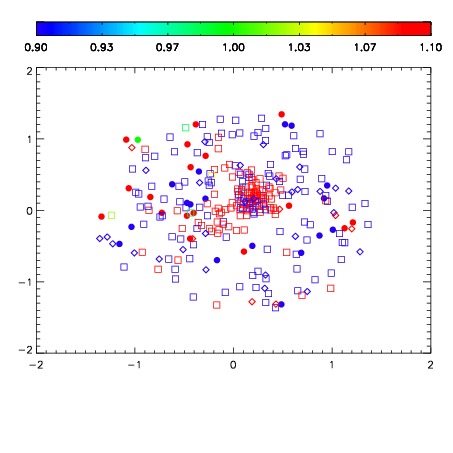
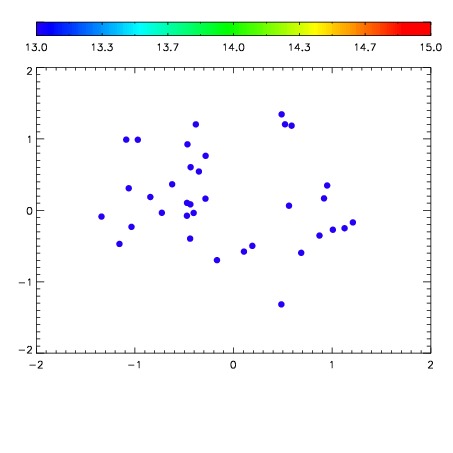

| Frame | Nreads | Zeropoints | Mag plots | Spatial mag deviation | Spatial sky 16325A emission deviations (filled: sky, open: star) | Spatial sky continuum emission | Spatial sky telluric CO2 absorption deviations (filled: H < 10) | |||||||||||||||||||||||
| 0 | 0 |
|
|
|
|
|
|
| IPAIR | NAME | SHIFT | NEWSHIFT | S/N | NAME | SHIFT | NEWSHIFT | S/N |
| 0 | 11130013 | 0.473210 | 0.00000 | 223.145 | 11130015 | -0.0108508 | 0.484061 | 221.181 |
| 1 | 11130016 | 0.470670 | 0.00253999 | 227.173 | 11130014 | -0.0108973 | 0.484107 | 228.321 |
| 2 | 11130017 | 0.471094 | 0.00211599 | 223.312 | 11130018 | -0.0105472 | 0.483757 | 222.787 |
| 3 | 11130012 | 0.472492 | 0.000717998 | 218.157 | 11130011 | 0.00000 | 0.473210 | 218.636 |