| Red | Green | Blue | |
| z | 17.64 | ||
| znorm | Inf | ||
| sky | -Inf | -Inf | -Inf |
| S/N | 19.7 | 32.3 | 33.6 |
| S/N(c) | 0.0 | 0.0 | 0.0 |
| SN(E/C) |
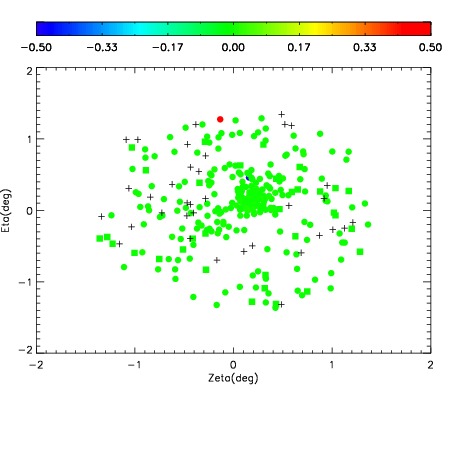
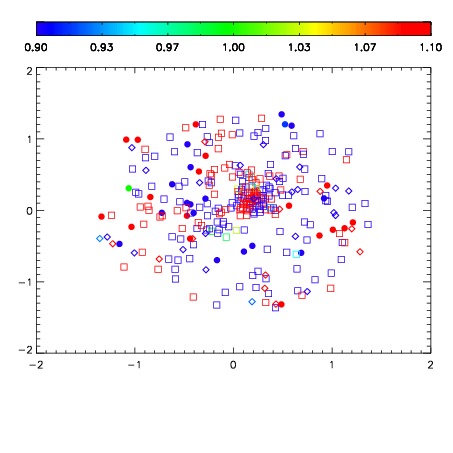
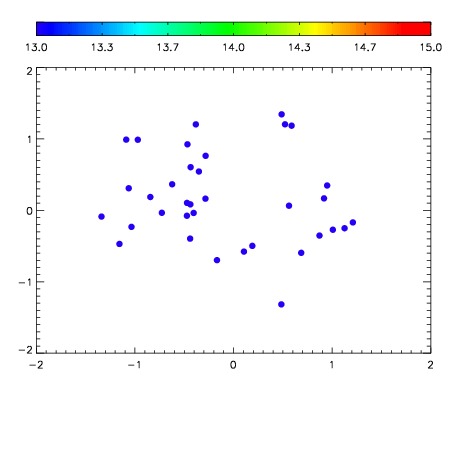

| Frame | Nreads | Zeropoints | Mag plots | Spatial mag deviation | Spatial sky 16325A emission deviations (filled: sky, open: star) | Spatial sky continuum emission | Spatial sky telluric CO2 absorption deviations (filled: H < 10) | |||||||||||||||||||||||
| 0 | 0 |
|
|
|
|
|
|
| IPAIR | NAME | SHIFT | NEWSHIFT | S/N | NAME | SHIFT | NEWSHIFT | S/N |
| 0 | 11410012 | 0.476666 | 0.00000 | 162.226 | 11410011 | 0.00000 | 0.476666 | 157.829 |
| 1 | 11410017 | 0.475165 | 0.00150099 | 190.905 | 11410015 | -0.00194052 | 0.478607 | 181.842 |
| 2 | 11410016 | 0.474702 | 0.00196400 | 182.858 | 11410018 | -0.000910006 | 0.477576 | 170.392 |
| 3 | 11410013 | 0.476599 | 6.69956e-05 | 173.894 | 11410014 | -0.00209254 | 0.478759 | 165.901 |