| Red | Green | Blue | |
| z | 17.64 | ||
| znorm | Inf | ||
| sky | -Inf | -Inf | -Inf |
| S/N | 12.7 | 22.1 | 21.3 |
| S/N(c) | 0.0 | 0.0 | 0.0 |
| SN(E/C) |
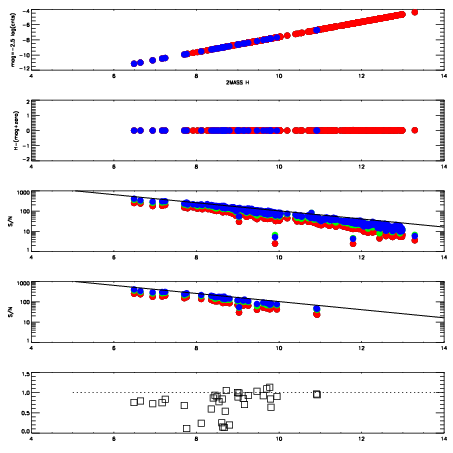
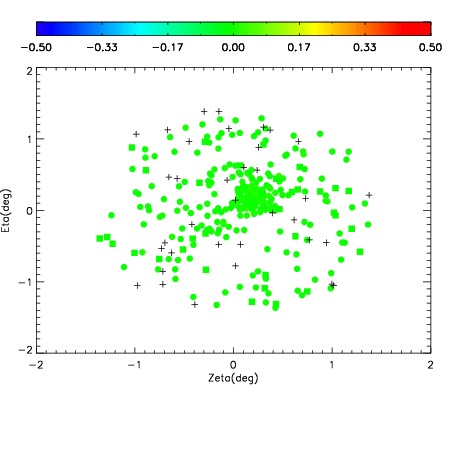
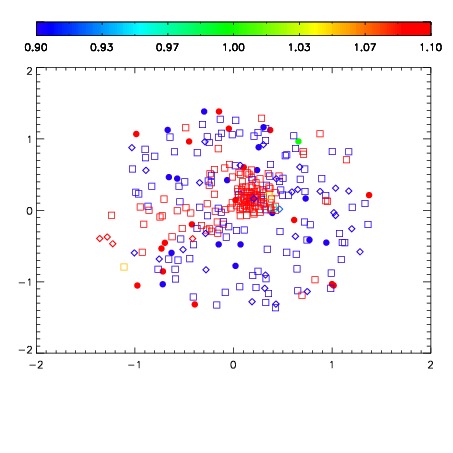
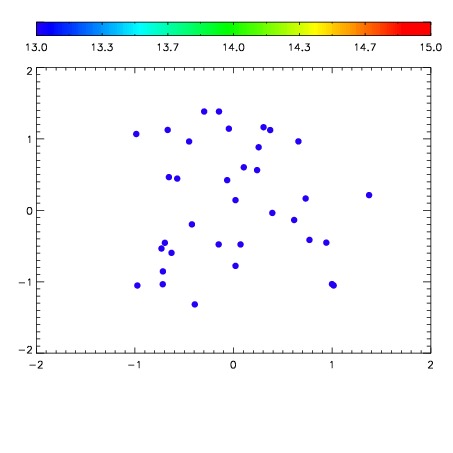

| Frame | Nreads | Zeropoints | Mag plots | Spatial mag deviation | Spatial sky 16325A emission deviations (filled: sky, open: star) | Spatial sky continuum emission | Spatial sky telluric CO2 absorption deviations (filled: H < 10) | |||||||||||||||||||||||
| 0 | 0 |
|
|
|
|
|
|
| IPAIR | NAME | SHIFT | NEWSHIFT | S/N | NAME | SHIFT | NEWSHIFT | S/N |
| 0 | 09990076 | 0.467264 | 0.00000 | 81.6029 | 09990078 | 0.000388126 | 0.466876 | 79.1935 |
| 1 | 09990080 | 0.466917 | 0.000346988 | 161.697 | 09990079 | -0.00182049 | 0.469085 | 172.086 |
| 2 | 09990077 | 0.467240 | 2.39909e-05 | 106.059 | 09990075 | 0.00000 | 0.467264 | 97.2756 |