| Red | Green | Blue | |
| z | 17.64 | ||
| znorm | Inf | ||
| sky | -Inf | -NaN | -Inf |
| S/N | 27.2 | 49.4 | 53.1 |
| S/N(c) | 0.0 | 0.0 | 0.0 |
| SN(E/C) |
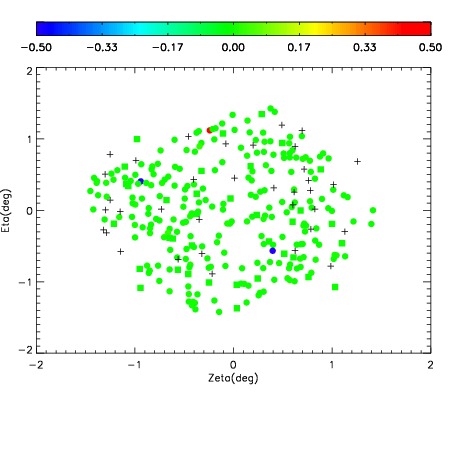
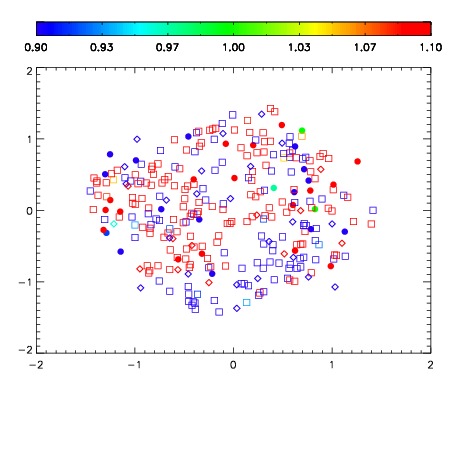
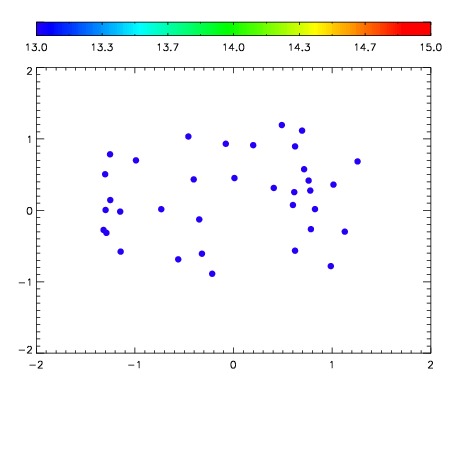

| Frame | Nreads | Zeropoints | Mag plots | Spatial mag deviation | Spatial sky 16325A emission deviations (filled: sky, open: star) | Spatial sky continuum emission | Spatial sky telluric CO2 absorption deviations (filled: H < 10) | |||||||||||||||||||||||
| 0 | 0 |
|
|
|
|
|
|
| IPAIR | NAME | SHIFT | NEWSHIFT | S/N | NAME | SHIFT | NEWSHIFT | S/N |
| 0 | 09950028 | 0.522622 | 0.00000 | 207.950 | 09950033 | 1.99522e-05 | 0.522602 | 208.157 |
| 1 | 09950027 | 0.522018 | 0.000603974 | 208.741 | 09950029 | -0.000658839 | 0.523281 | 210.816 |
| 2 | 09950032 | 0.522299 | 0.000322998 | 208.695 | 09950030 | -0.000698815 | 0.523321 | 209.795 |
| 3 | 09950031 | 0.522278 | 0.000343978 | 208.332 | 09950026 | 0.00000 | 0.522622 | 208.678 |