| Red | Green | Blue | |
| z | 17.64 | ||
| znorm | Inf | ||
| sky | -Inf | -Inf | -Inf |
| S/N | 22.9 | 41.8 | 46.4 |
| S/N(c) | 0.0 | 0.0 | 0.0 |
| SN(E/C) |
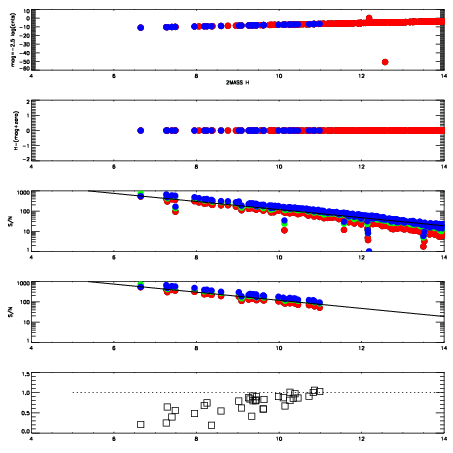
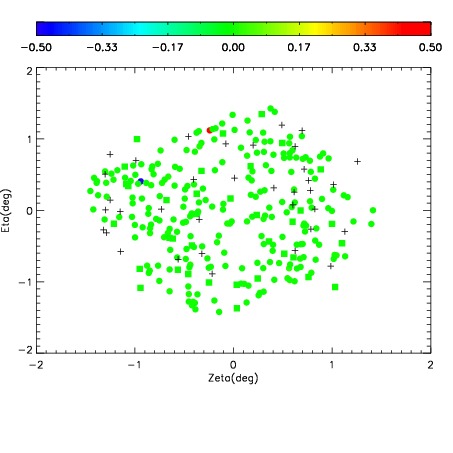
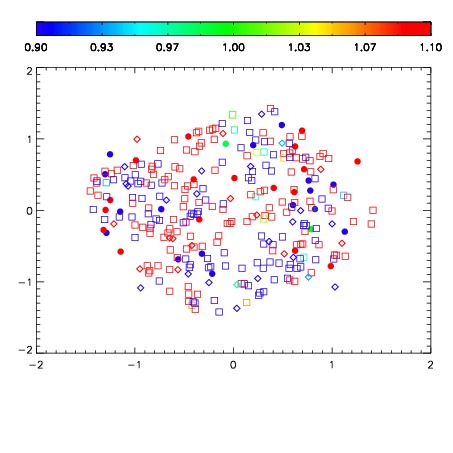
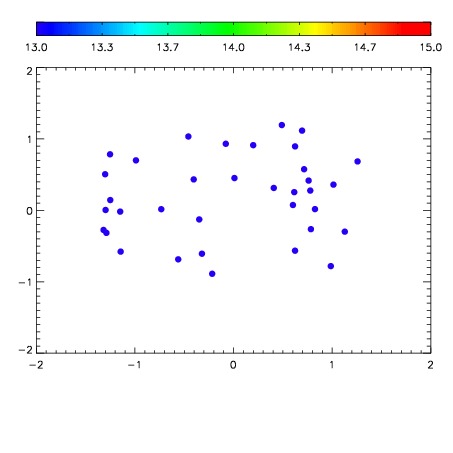

| Frame | Nreads | Zeropoints | Mag plots | Spatial mag deviation | Spatial sky 16325A emission deviations (filled: sky, open: star) | Spatial sky continuum emission | Spatial sky telluric CO2 absorption deviations (filled: H < 10) | |||||||||||||||||||||||
| 0 | 0 |
|
|
|
|
|
|
| IPAIR | NAME | SHIFT | NEWSHIFT | S/N | NAME | SHIFT | NEWSHIFT | S/N |
| 0 | 09970035 | 0.524527 | 0.00000 | 215.670 | 09970033 | 0.00000 | 0.524527 | 214.548 |
| 1 | 09970039 | 0.523251 | 0.00127602 | 221.098 | 09970040 | 0.00258317 | 0.521944 | 221.434 |
| 2 | 09970038 | 0.523797 | 0.000730038 | 221.007 | 09970037 | 0.00210444 | 0.522423 | 219.472 |
| 3 | 09970034 | 0.523802 | 0.000725031 | 215.851 | 09970036 | 0.00189489 | 0.522632 | 219.248 |