| Red | Green | Blue | |
| z | 17.64 | ||
| znorm | Inf | ||
| sky | -Inf | -Inf | -Inf |
| S/N | 23.0 | 42.2 | 46.7 |
| S/N(c) | 0.0 | 0.0 | 0.0 |
| SN(E/C) |


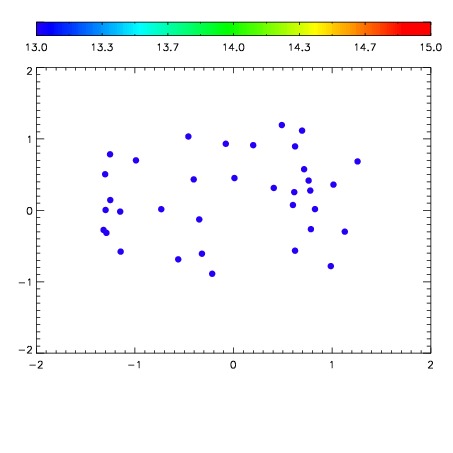

| Frame | Nreads | Zeropoints | Mag plots | Spatial mag deviation | Spatial sky 16325A emission deviations (filled: sky, open: star) | Spatial sky continuum emission | Spatial sky telluric CO2 absorption deviations (filled: H < 10) | |||||||||||||||||||||||
| 0 | 0 |
|
|
|
|
|
|
| IPAIR | NAME | SHIFT | NEWSHIFT | S/N | NAME | SHIFT | NEWSHIFT | S/N |
| 0 | 09980024 | 0.524626 | 0.00000 | 223.813 | 09980026 | 0.000561709 | 0.524064 | 218.127 |
| 1 | 09980023 | 0.524488 | 0.000138044 | 224.257 | 09980022 | 0.00000 | 0.524626 | 221.634 |
| 2 | 09980027 | 0.523400 | 0.00122601 | 215.959 | 09980025 | 0.00111729 | 0.523509 | 217.934 |
| 3 | 09980028 | 0.523179 | 0.00144702 | 215.722 | 09980029 | 0.000949658 | 0.523676 | 214.275 |