| Red | Green | Blue | |
| z | 17.64 | ||
| znorm | Inf | ||
| sky | -Inf | -Inf | -Inf |
| S/N | 27.7 | 48.3 | 50.8 |
| S/N(c) | 0.0 | 0.0 | 0.0 |
| SN(E/C) |

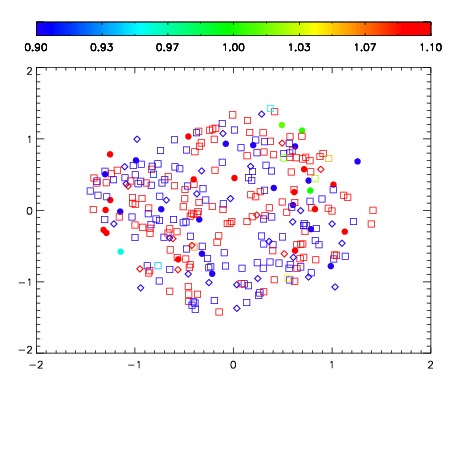
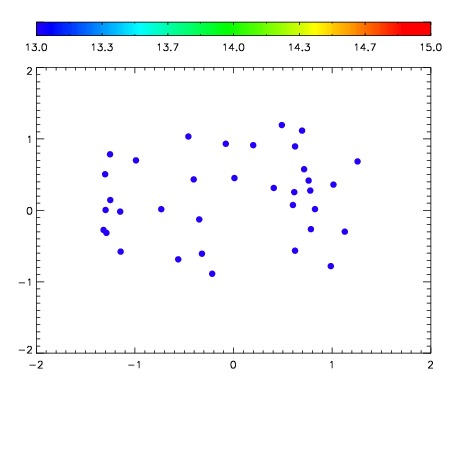

| Frame | Nreads | Zeropoints | Mag plots | Spatial mag deviation | Spatial sky 16325A emission deviations (filled: sky, open: star) | Spatial sky continuum emission | Spatial sky telluric CO2 absorption deviations (filled: H < 10) | |||||||||||||||||||||||
| 0 | 0 |
|
|
|
|
|
|
| IPAIR | NAME | SHIFT | NEWSHIFT | S/N | NAME | SHIFT | NEWSHIFT | S/N |
| 0 | 10220032 | 0.494559 | 0.00000 | 199.255 | 10220030 | 0.00501769 | 0.489541 | 201.272 |
| 1 | 10220029 | 0.493596 | 0.000963002 | 201.208 | 10220031 | 0.00457127 | 0.489988 | 201.872 |
| 2 | 10220028 | 0.492968 | 0.00159100 | 198.498 | 10220027 | 0.00000 | 0.494559 | 198.138 |
| 3 | 10220033 | 0.493725 | 0.000833988 | 197.039 | 10220034 | 0.00475741 | 0.489802 | 190.818 |