| Red | Green | Blue | |
| z | 17.64 | ||
| znorm | Inf | ||
| sky | -NaN | -NaN | -Inf |
| S/N | 30.4 | 51.1 | 55.9 |
| S/N(c) | 0.0 | 0.0 | 0.0 |
| SN(E/C) |
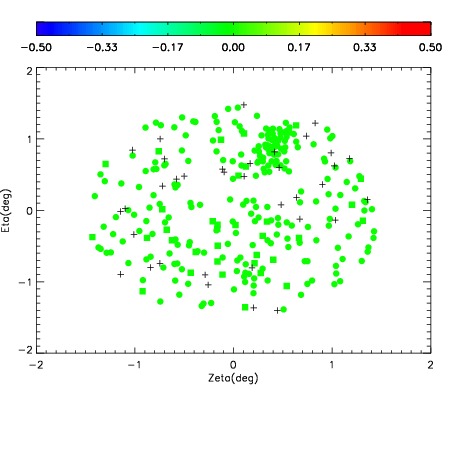
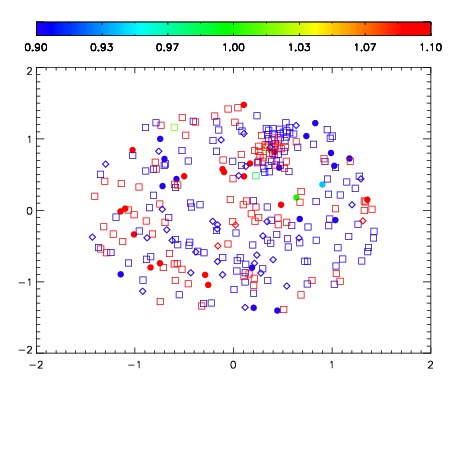
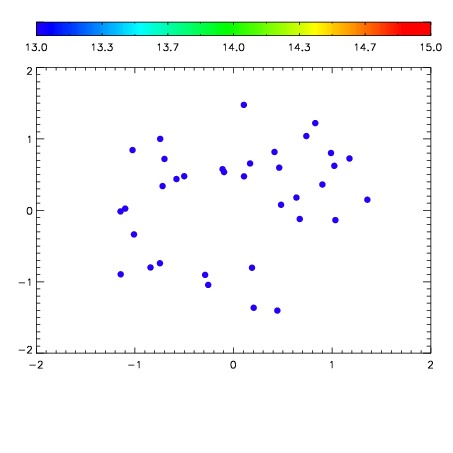

| Frame | Nreads | Zeropoints | Mag plots | Spatial mag deviation | Spatial sky 16325A emission deviations (filled: sky, open: star) | Spatial sky continuum emission | Spatial sky telluric CO2 absorption deviations (filled: H < 10) | |||||||||||||||||||||||
| 0 | 0 |
|
|
|
|
|
|
| IPAIR | NAME | SHIFT | NEWSHIFT | S/N | NAME | SHIFT | NEWSHIFT | S/N |
| 0 | 10890043 | 0.511346 | 0.00000 | 230.745 | 10890040 | -0.00124894 | 0.512595 | 231.769 |
| 1 | 10890042 | 0.510646 | 0.000699997 | 230.502 | 10890044 | -0.00123466 | 0.512581 | 230.899 |
| 2 | 10890038 | 0.508430 | 0.00291598 | 229.179 | 10890041 | -0.00126604 | 0.512612 | 230.015 |
| 3 | 10890039 | 0.509002 | 0.00234401 | 228.682 | 10890037 | 0.00000 | 0.511346 | 226.500 |