| Red | Green | Blue | |
| z | 17.64 | ||
| znorm | Inf | ||
| sky | -NaN | -NaN | -Inf |
| S/N | 26.5 | 45.1 | 50.0 |
| S/N(c) | 0.0 | 0.0 | 0.0 |
| SN(E/C) |
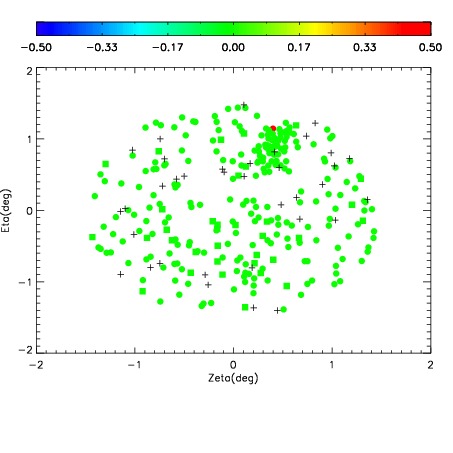
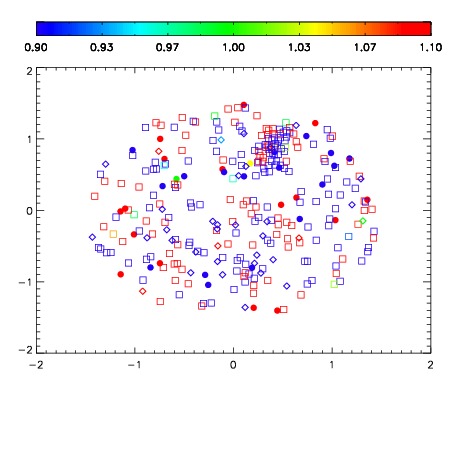
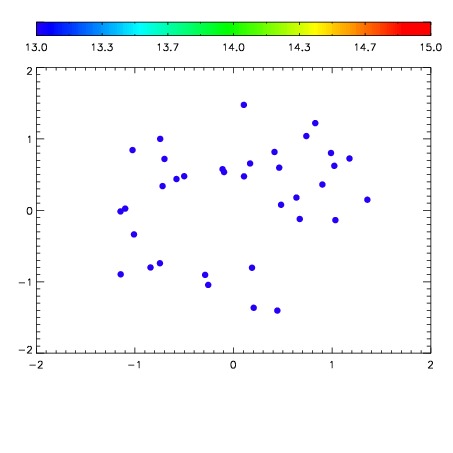

| Frame | Nreads | Zeropoints | Mag plots | Spatial mag deviation | Spatial sky 16325A emission deviations (filled: sky, open: star) | Spatial sky continuum emission | Spatial sky telluric CO2 absorption deviations (filled: H < 10) | |||||||||||||||||||||||
| 0 | 0 |
|
|
|
|
|
|
| IPAIR | NAME | SHIFT | NEWSHIFT | S/N | NAME | SHIFT | NEWSHIFT | S/N |
| 0 | 11040029 | 0.483477 | 0.00000 | 209.578 | 11040034 | -0.00162196 | 0.485099 | 208.053 |
| 1 | 11040032 | 0.481271 | 0.00220600 | 211.712 | 11040030 | -9.28014e-05 | 0.483570 | 218.074 |
| 2 | 11040028 | 0.483024 | 0.000452995 | 210.017 | 11040031 | -0.00111013 | 0.484587 | 215.225 |
| 3 | 11040033 | 0.481210 | 0.00226700 | 207.700 | 11040027 | 0.00000 | 0.483477 | 206.004 |