| Red | Green | Blue | |
| z | 17.64 | ||
| znorm | Inf | ||
| sky | -Inf | -NaN | -Inf |
| S/N | 21.6 | 39.5 | 39.9 |
| S/N(c) | 0.0 | 0.0 | 0.0 |
| SN(E/C) |
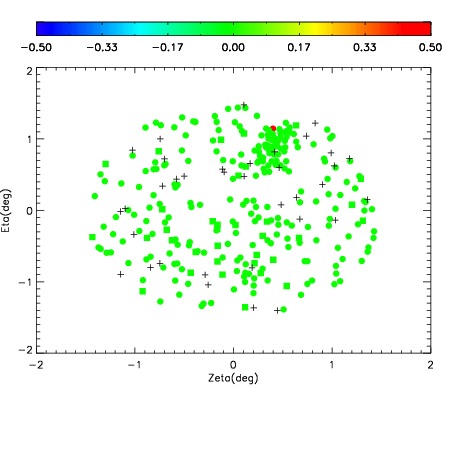
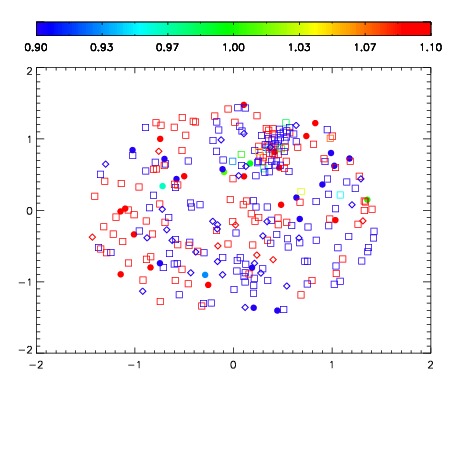
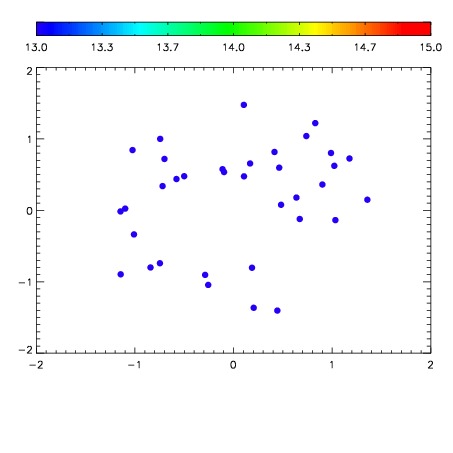

| Frame | Nreads | Zeropoints | Mag plots | Spatial mag deviation | Spatial sky 16325A emission deviations (filled: sky, open: star) | Spatial sky continuum emission | Spatial sky telluric CO2 absorption deviations (filled: H < 10) | |||||||||||||||||||||||
| 0 | 0 |
|
|
|
|
|
|
| IPAIR | NAME | SHIFT | NEWSHIFT | S/N | NAME | SHIFT | NEWSHIFT | S/N |
| 0 | 11340014 | 0.484528 | 0.00000 | 217.953 | 11340019 | 0.000601057 | 0.483927 | 205.884 |
| 1 | 11340018 | 0.483321 | 0.00120699 | 222.138 | 11340015 | 1.79990e-06 | 0.484526 | 222.237 |
| 2 | 11340017 | 0.483260 | 0.00126800 | 220.880 | 11340016 | -0.000310934 | 0.484839 | 219.828 |
| 3 | 11340013 | 0.484177 | 0.000351012 | 194.999 | 11340012 | 0.00000 | 0.484528 | 154.750 |