| Red | Green | Blue | |
| z | 17.64 | ||
| znorm | Inf | ||
| sky | -Inf | -NaN | -Inf |
| S/N | 25.8 | 45.4 | 47.9 |
| S/N(c) | 0.0 | 0.0 | 0.0 |
| SN(E/C) |
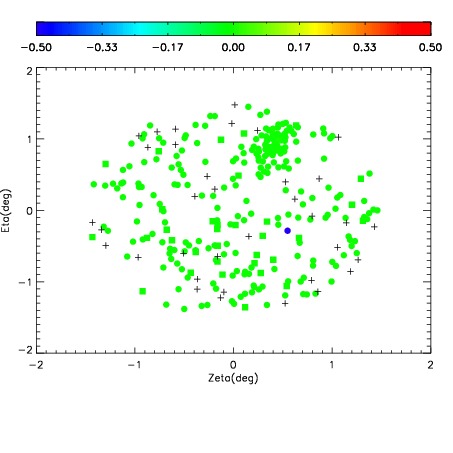

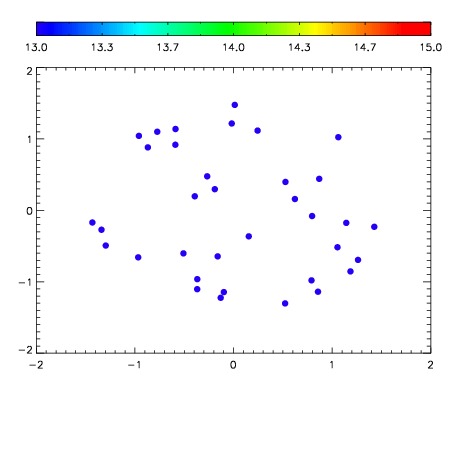

| Frame | Nreads | Zeropoints | Mag plots | Spatial mag deviation | Spatial sky 16325A emission deviations (filled: sky, open: star) | Spatial sky continuum emission | Spatial sky telluric CO2 absorption deviations (filled: H < 10) | |||||||||||||||||||||||
| 0 | 0 |
|
|
|
|
|
|
| IPAIR | NAME | SHIFT | NEWSHIFT | S/N | NAME | SHIFT | NEWSHIFT | S/N |
| 0 | 11400017 | 0.474695 | 0.00000 | 214.406 | 11400015 | -0.000405479 | 0.475100 | 215.268 |
| 1 | 11400016 | 0.473970 | 0.000725001 | 219.814 | 11400011 | 0.00000 | 0.474695 | 225.368 |
| 2 | 11400012 | 0.473016 | 0.00167900 | 211.208 | 11400018 | 0.000223089 | 0.474472 | 211.625 |
| 3 | 11400013 | 0.474497 | 0.000198007 | 201.991 | 11400014 | -0.000378733 | 0.475074 | 208.429 |