| Red | Green | Blue | |
| z | 17.64 | ||
| znorm | Inf | ||
| sky | -Inf | -Inf | -Inf |
| S/N | 25.2 | 45.5 | 50.2 |
| S/N(c) | 0.0 | 0.0 | 0.0 |
| SN(E/C) |
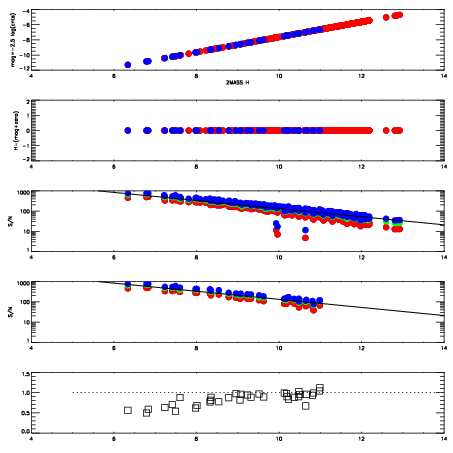
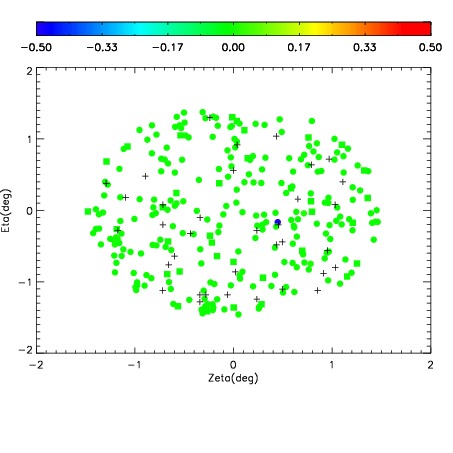
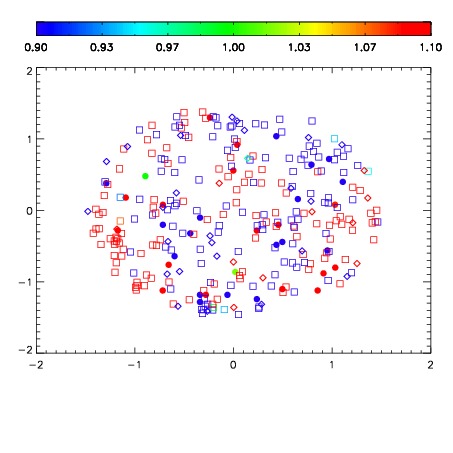


| Frame | Nreads | Zeropoints | Mag plots | Spatial mag deviation | Spatial sky 16325A emission deviations (filled: sky, open: star) | Spatial sky continuum emission | Spatial sky telluric CO2 absorption deviations (filled: H < 10) | |||||||||||||||||||||||
| 0 | 0 |
|
|
|
|
|
|
| IPAIR | NAME | SHIFT | NEWSHIFT | S/N | NAME | SHIFT | NEWSHIFT | S/N |
| 0 | 10800061 | 0.492531 | 0.00000 | 216.693 | 10800063 | -0.000752000 | 0.493283 | 213.786 |
| 1 | 10800068 | 0.489167 | 0.00336400 | 225.834 | 10800067 | -0.000544741 | 0.493076 | 226.294 |
| 2 | 10800065 | 0.490916 | 0.00161499 | 217.318 | 10800066 | -0.000246291 | 0.492777 | 215.967 |
| 3 | 10800064 | 0.490464 | 0.00206700 | 213.989 | 10800062 | -0.00114115 | 0.493672 | 213.714 |
| 4 | 10800060 | 0.491944 | 0.000587016 | 204.906 | 10800059 | 0.00000 | 0.492531 | 204.569 |