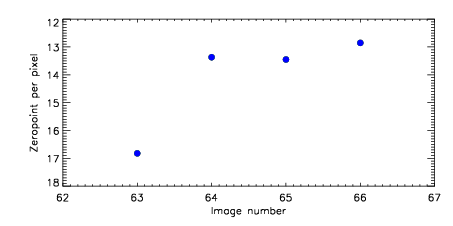
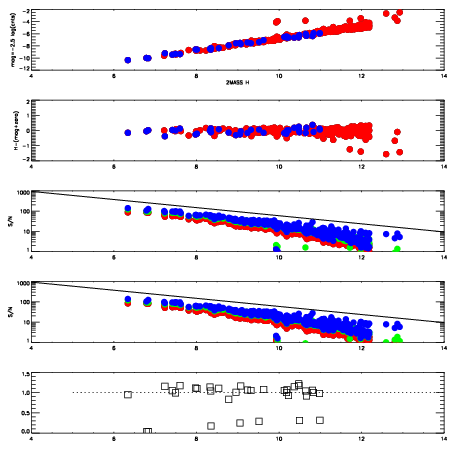
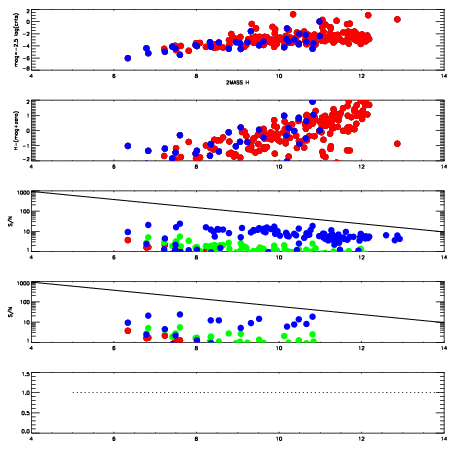
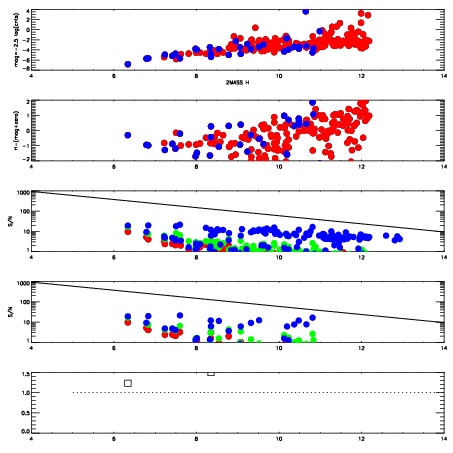
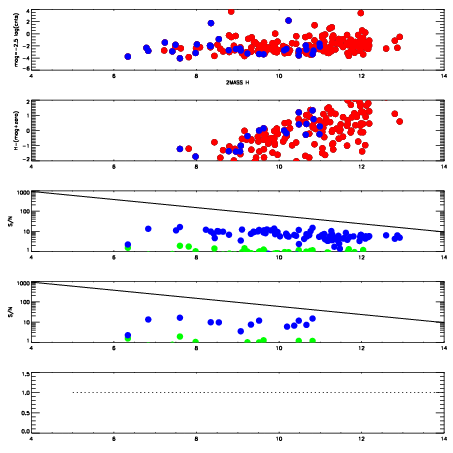
| Frame | Nreads | Zeropoints | Mag plots
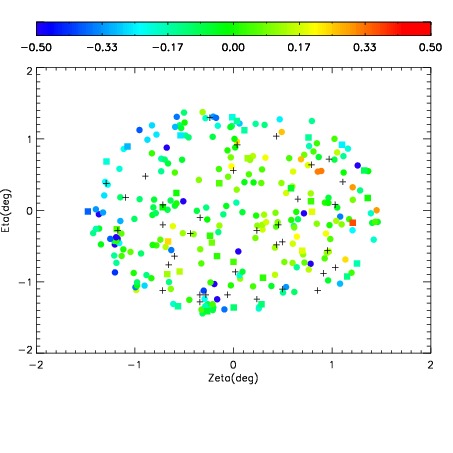
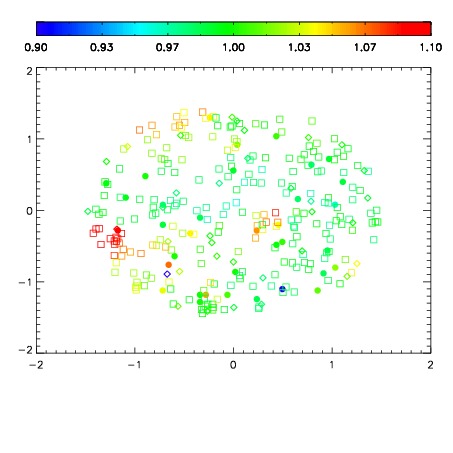
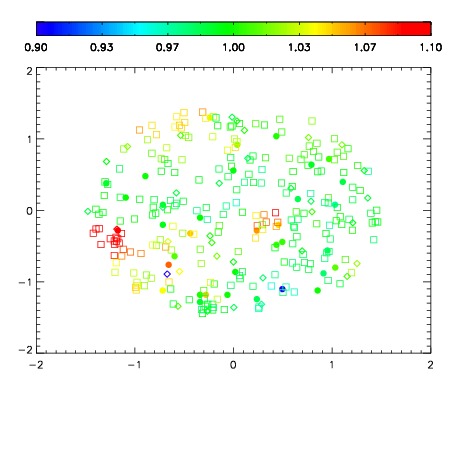
| Spatial mag deviation
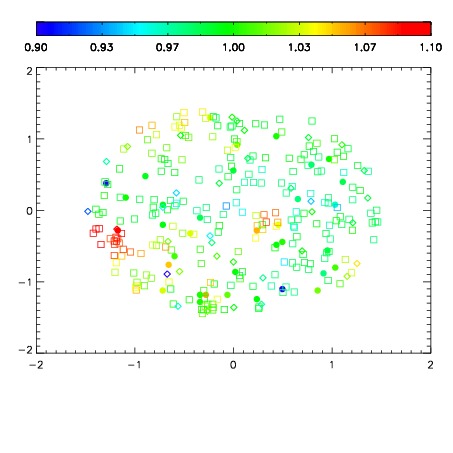
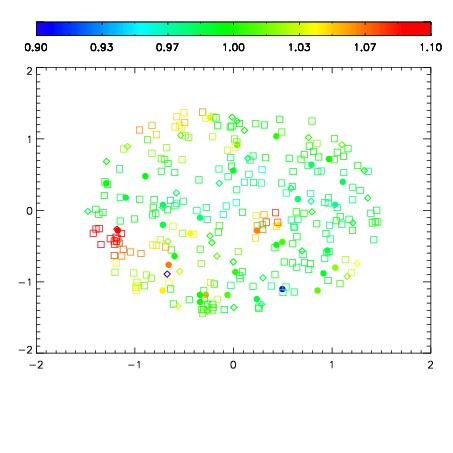
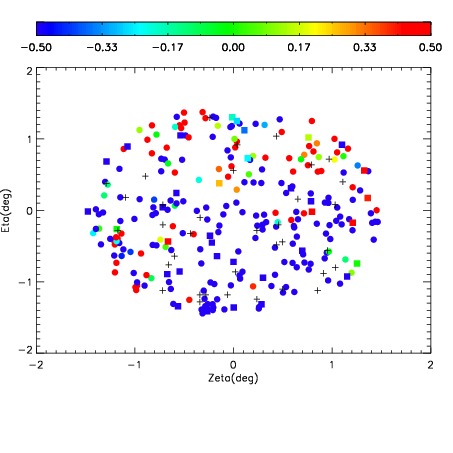
| Spatial sky 16325A emission deviations (filled: sky, open: star)
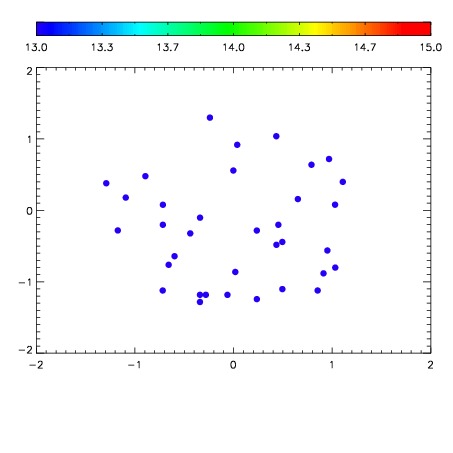
| Spatial sky continuum emission
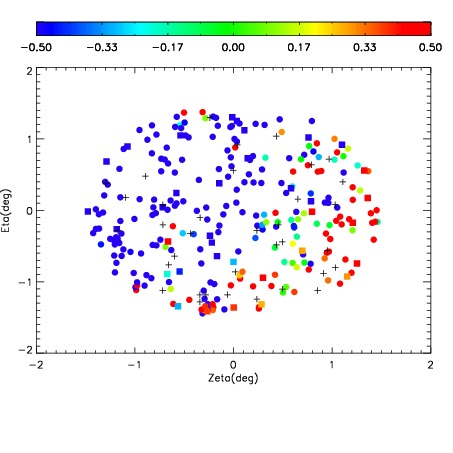
| Spatial sky telluric CO2 absorption deviations (filled: H < 10)
|
| 10840063
| 47
| | Red | Green | Blue
| | z | | 16.82
| | znorm | | 12.64
| | sky | 12.3 | 12.2 | 12.1
| | S/N | 1.7 | 3.3 | 3.3
| | S/N(c) | 1.6 | 2.8 | 3.2
| | SN(E/C) 1.04
|
| 
| 
| 
| 
| 
|
| 10840064
| 47
| | Red | Green | Blue
| | z | | 13.37
| | znorm | | 9.19
| | sky | 12.2 | 12.1 | 12.1
| | S/N | -0.0 | -0.2 | -0.1
| | S/N(c) | 0.0 | 0.0 | 0.0
| | SN(E/C)10.12
|
| 
| 
| 
| 
| 
|
| 10840065
| 47
| | Red | Green | Blue
| | z | | 13.45
| | znorm | | 9.27
| | sky | 12.2 | 12.1 | 12.1
| | S/N | -0.2 | -0.1 | -0.1
| | S/N(c) | 0.0 | 0.0 | 0.0
| | SN(E/C) 8.46
|
| 
| 
| 
| 
| 
|
| 10840066
| 47
| | Red | Green | Blue
| | z | | 12.85
| | znorm | | 8.67
| | sky | 12.7 | 12.6 | 12.6
| | S/N | -0.0 | -0.0 | -0.1
| | S/N(c) | 0.0 | 0.0 | 0.0
| | SN(E/C)17.67
|
| 
| 
| 
| 
| 
|