| Red | Green | Blue | |
| z | 17.64 | ||
| znorm | Inf | ||
| sky | -Inf | -Inf | -Inf |
| S/N | 25.2 | 43.2 | 48.0 |
| S/N(c) | 0.0 | 0.0 | 0.0 |
| SN(E/C) |
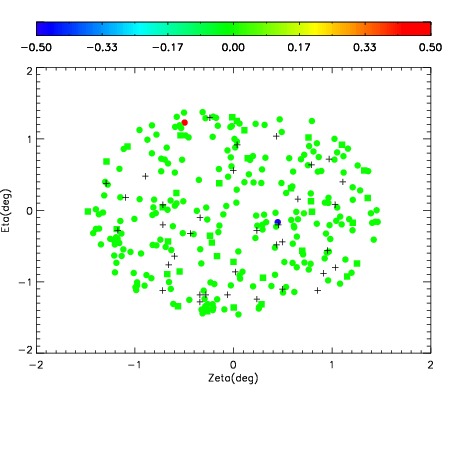
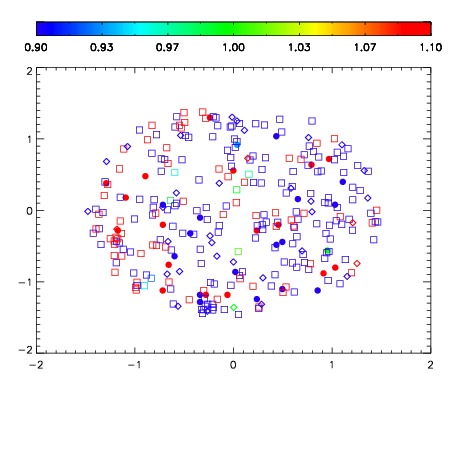


| Frame | Nreads | Zeropoints | Mag plots | Spatial mag deviation | Spatial sky 16325A emission deviations (filled: sky, open: star) | Spatial sky continuum emission | Spatial sky telluric CO2 absorption deviations (filled: H < 10) | |||||||||||||||||||||||
| 0 | 0 |
|
|
|
|
|
|
| IPAIR | NAME | SHIFT | NEWSHIFT | S/N | NAME | SHIFT | NEWSHIFT | S/N |
| 0 | 11040050 | 0.476593 | 0.00000 | 196.359 | 11040052 | -0.00303211 | 0.479625 | 195.983 |
| 1 | 11040051 | 0.476084 | 0.000508994 | 199.432 | 11040049 | 0.00000 | 0.476593 | 198.747 |
| 2 | 11040055 | 0.474239 | 0.00235400 | 190.127 | 11040053 | -0.00338681 | 0.479980 | 192.930 |
| 3 | 11040054 | 0.474253 | 0.00233999 | 189.507 | 11040056 | -0.00335154 | 0.479945 | 190.371 |