| Red | Green | Blue | |
| z | 17.64 | ||
| znorm | Inf | ||
| sky | -Inf | -Inf | -Inf |
| S/N | 19.5 | 36.0 | 37.8 |
| S/N(c) | 0.0 | 0.0 | 0.0 |
| SN(E/C) |
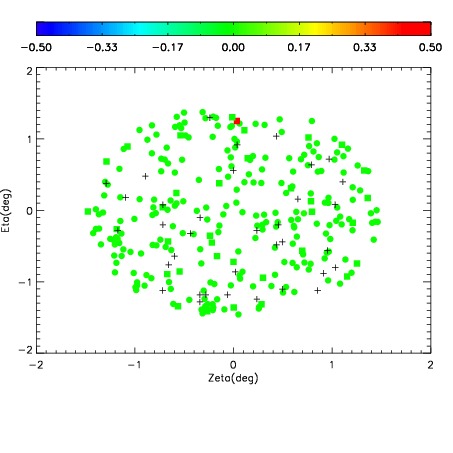
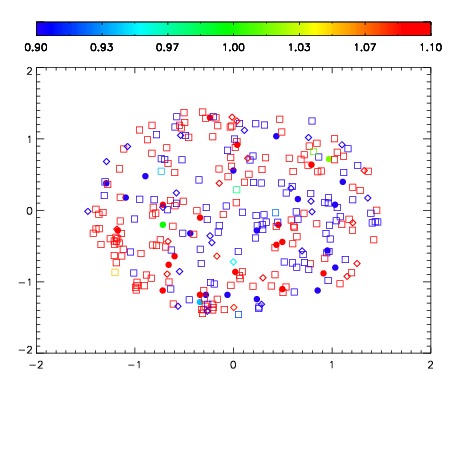
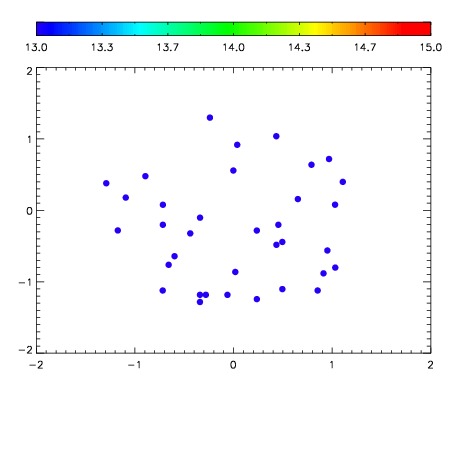

| Frame | Nreads | Zeropoints | Mag plots | Spatial mag deviation | Spatial sky 16325A emission deviations (filled: sky, open: star) | Spatial sky continuum emission | Spatial sky telluric CO2 absorption deviations (filled: H < 10) | |||||||||||||||||||||||
| 0 | 0 |
|
|
|
|
|
|
| IPAIR | NAME | SHIFT | NEWSHIFT | S/N | NAME | SHIFT | NEWSHIFT | S/N |
| 0 | 11080054 | 0.474532 | 0.00000 | 190.678 | 11080048 | 0.00000 | 0.474532 | 178.185 |
| 1 | 11080050 | 0.474180 | 0.000351995 | 208.004 | 11080055 | -0.00121371 | 0.475746 | 209.757 |
| 2 | 11080049 | 0.473629 | 0.000903010 | 200.559 | 11080051 | -0.00321183 | 0.477744 | 199.219 |
| 3 | 11080053 | 0.474004 | 0.000528008 | 196.904 | 11080052 | -0.00286961 | 0.477402 | 190.566 |