| Red | Green | Blue | |
| z | 17.64 | ||
| znorm | Inf | ||
| sky | -NaN | -Inf | -Inf |
| S/N | 29.7 | 50.0 | 51.9 |
| S/N(c) | 0.0 | 0.0 | 0.0 |
| SN(E/C) |
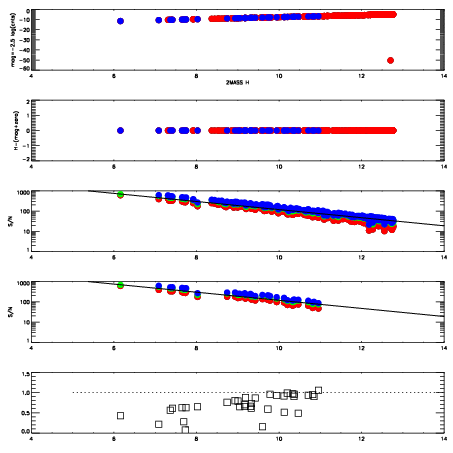

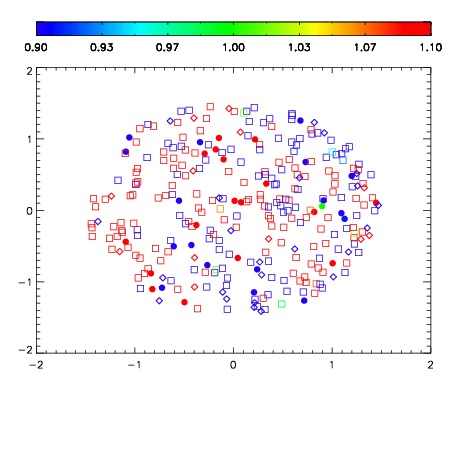
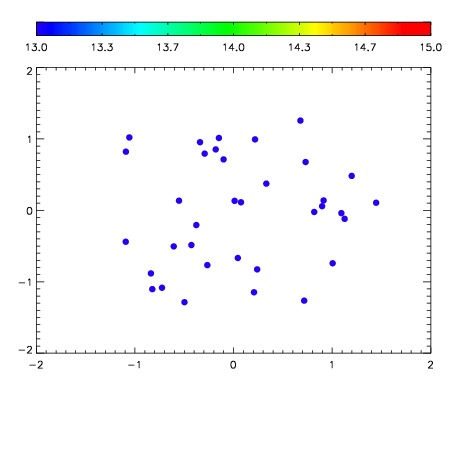

| Frame | Nreads | Zeropoints | Mag plots | Spatial mag deviation | Spatial sky 16325A emission deviations (filled: sky, open: star) | Spatial sky continuum emission | Spatial sky telluric CO2 absorption deviations (filled: H < 10) | |||||||||||||||||||||||
| 0 | 0 |
|
|
|
|
|
|
| IPAIR | NAME | SHIFT | NEWSHIFT | S/N | NAME | SHIFT | NEWSHIFT | S/N |
| 0 | 11070017 | 0.482996 | 0.00000 | 201.859 | 11070011 | 0.00000 | 0.482996 | 197.359 |
| 1 | 11070012 | 0.481698 | 0.00129798 | 208.884 | 11070015 | -0.00122748 | 0.484223 | 207.490 |
| 2 | 11070013 | 0.482363 | 0.000633001 | 208.850 | 11070014 | -0.00174750 | 0.484743 | 207.074 |
| 3 | 11070016 | 0.481342 | 0.00165400 | 202.956 | 11070018 | 0.000905768 | 0.482090 | 201.255 |