| Red | Green | Blue | |
| z | 17.64 | ||
| znorm | Inf | ||
| sky | -Inf | -NaN | -Inf |
| S/N | 24.6 | 44.0 | 45.8 |
| S/N(c) | 0.0 | 0.0 | 0.0 |
| SN(E/C) |
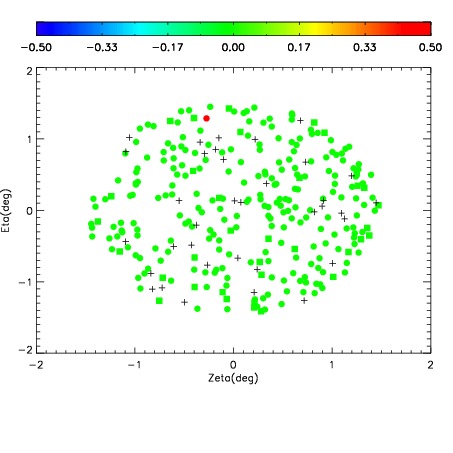
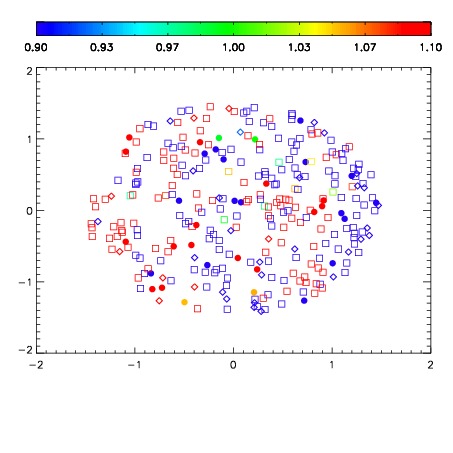
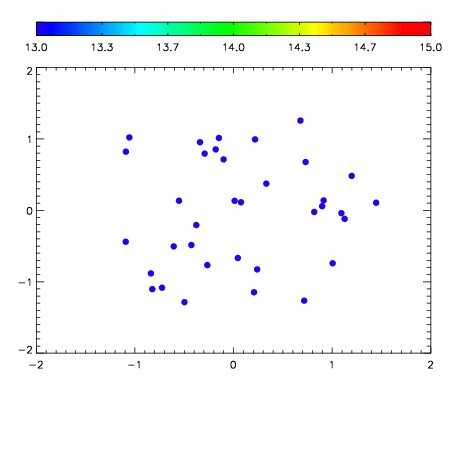

| Frame | Nreads | Zeropoints | Mag plots | Spatial mag deviation | Spatial sky 16325A emission deviations (filled: sky, open: star) | Spatial sky continuum emission | Spatial sky telluric CO2 absorption deviations (filled: H < 10) | |||||||||||||||||||||||
| 0 | 0 |
|
|
|
|
|
|
| IPAIR | NAME | SHIFT | NEWSHIFT | S/N | NAME | SHIFT | NEWSHIFT | S/N |
| 0 | 11110024 | 0.481289 | 0.00000 | 176.212 | 11110026 | -0.00355472 | 0.484844 | 186.102 |
| 1 | 11110028 | 0.475996 | 0.00529301 | 190.399 | 11110029 | -0.00424337 | 0.485532 | 200.177 |
| 2 | 11110027 | 0.476797 | 0.00449198 | 189.174 | 11110025 | -0.00334795 | 0.484637 | 189.507 |
| 3 | 11110023 | 0.480974 | 0.000315011 | 180.911 | 11110022 | 0.00000 | 0.481289 | 186.321 |