| Red | Green | Blue | |
| z | 17.64 | ||
| znorm | Inf | ||
| sky | -NaN | -Inf | -Inf |
| S/N | 24.7 | 42.6 | 45.4 |
| S/N(c) | 0.0 | 0.0 | 0.0 |
| SN(E/C) |
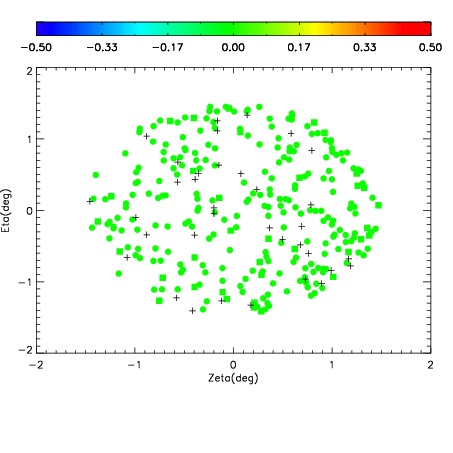
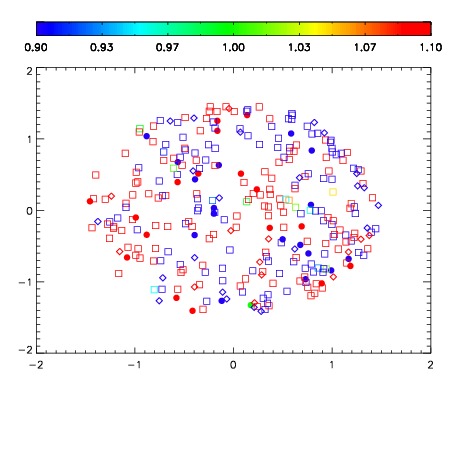
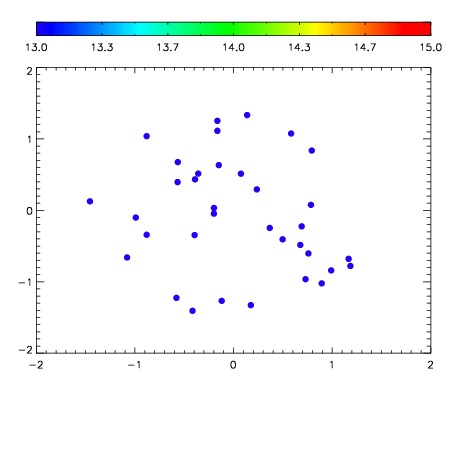

| Frame | Nreads | Zeropoints | Mag plots | Spatial mag deviation | Spatial sky 16325A emission deviations (filled: sky, open: star) | Spatial sky continuum emission | Spatial sky telluric CO2 absorption deviations (filled: H < 10) | |||||||||||||||||||||||
| 0 | 0 |
|
|
|
|
|
|
| IPAIR | NAME | SHIFT | NEWSHIFT | S/N | NAME | SHIFT | NEWSHIFT | S/N |
| 0 | 10820062 | 0.482604 | 0.00000 | 203.941 | 10820064 | -0.00165867 | 0.484263 | 198.615 |
| 1 | 10820066 | 0.480760 | 0.00184399 | 230.953 | 10820068 | -0.00191013 | 0.484514 | 230.186 |
| 2 | 10820067 | 0.481380 | 0.00122401 | 223.421 | 10820065 | -0.00243576 | 0.485040 | 223.785 |
| 3 | 10820063 | 0.482385 | 0.000218987 | 212.962 | 10820061 | 0.00000 | 0.482604 | 211.250 |