| Red | Green | Blue | |
| z | 17.64 | ||
| znorm | Inf | ||
| sky | -Inf | -Inf | -Inf |
| S/N | 22.9 | 41.2 | 42.5 |
| S/N(c) | 0.0 | 0.0 | 0.0 |
| SN(E/C) |
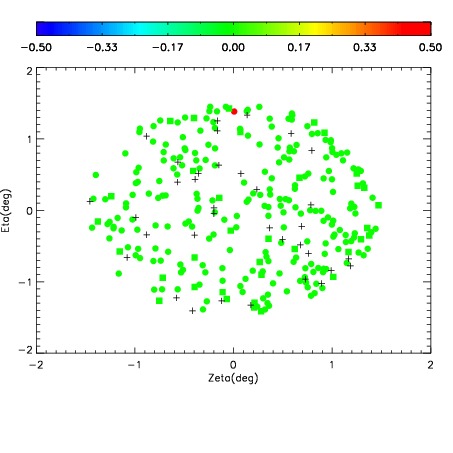
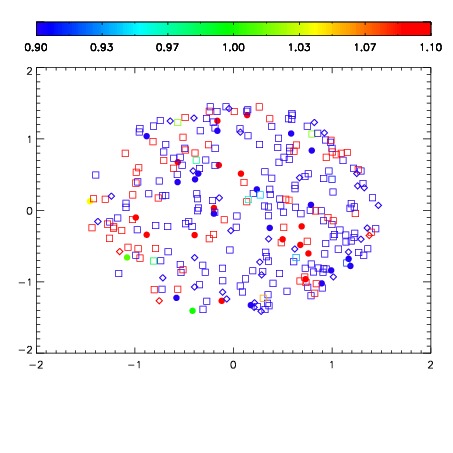
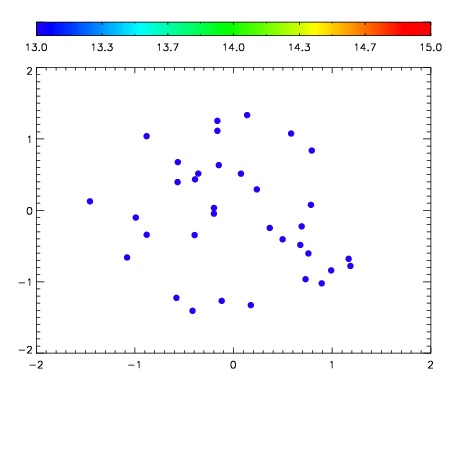

| Frame | Nreads | Zeropoints | Mag plots | Spatial mag deviation | Spatial sky 16325A emission deviations (filled: sky, open: star) | Spatial sky continuum emission | Spatial sky telluric CO2 absorption deviations (filled: H < 10) | |||||||||||||||||||||||
| 0 | 0 |
|
|
|
|
|
|
| IPAIR | NAME | SHIFT | NEWSHIFT | S/N | NAME | SHIFT | NEWSHIFT | S/N |
| 0 | 11150017 | 0.485717 | 0.00000 | 190.709 | 11150015 | -0.00127736 | 0.486994 | 180.807 |
| 1 | 11150012 | 0.484704 | 0.00101301 | 205.145 | 11150011 | 0.00000 | 0.485717 | 205.107 |
| 2 | 11150013 | 0.484659 | 0.00105801 | 201.671 | 11150014 | -0.00129114 | 0.487008 | 190.138 |
| 3 | 11150016 | 0.485716 | 1.01328e-06 | 186.073 | 11150018 | -0.000754212 | 0.486471 | 164.553 |