| Red | Green | Blue | |
| z | 17.64 | ||
| znorm | Inf | ||
| sky | -Inf | -Inf | -Inf |
| S/N | 28.9 | 50.8 | 56.1 |
| S/N(c) | 0.0 | 0.0 | 0.0 |
| SN(E/C) |
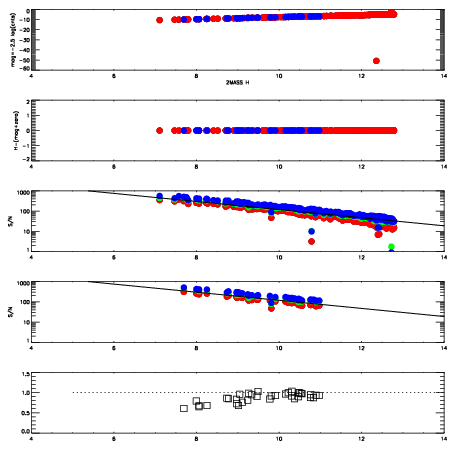
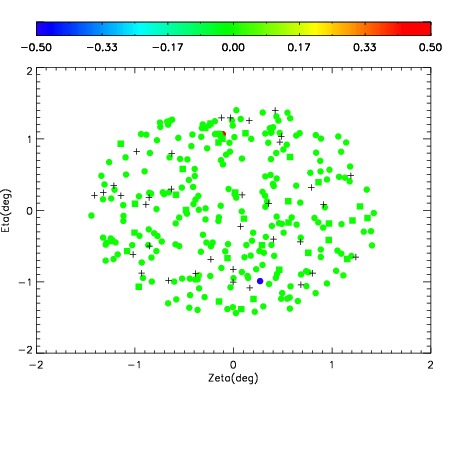
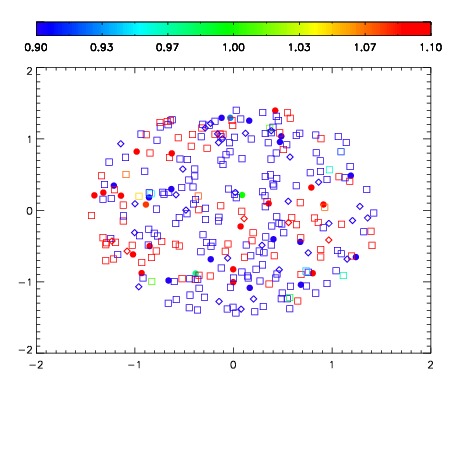
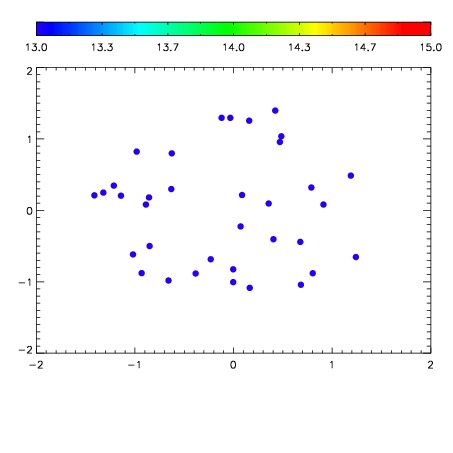

| Frame | Nreads | Zeropoints | Mag plots | Spatial mag deviation | Spatial sky 16325A emission deviations (filled: sky, open: star) | Spatial sky continuum emission | Spatial sky telluric CO2 absorption deviations (filled: H < 10) | |||||||||||||||||||||||
| 0 | 0 |
|
|
|
|
|
|
| IPAIR | NAME | SHIFT | NEWSHIFT | S/N | NAME | SHIFT | NEWSHIFT | S/N |
| 0 | 10240076 | 0.501247 | 0.00000 | 261.722 | 10240074 | 0.00338856 | 0.497858 | 260.186 |
| 1 | 10240075 | 0.500888 | 0.000358999 | 262.742 | 10240077 | 0.00361802 | 0.497629 | 261.425 |
| 2 | 10240072 | 0.497926 | 0.00332099 | 251.984 | 10240073 | 0.00343920 | 0.497808 | 252.949 |
| 3 | 10240071 | 0.497258 | 0.00398898 | 250.351 | 10240070 | 0.00000 | 0.501247 | 247.895 |