| Red | Green | Blue | |
| z | 17.64 | ||
| znorm | Inf | ||
| sky | -Inf | -Inf | -Inf |
| S/N | 26.9 | 45.2 | 50.0 |
| S/N(c) | 0.0 | 0.0 | 0.0 |
| SN(E/C) |
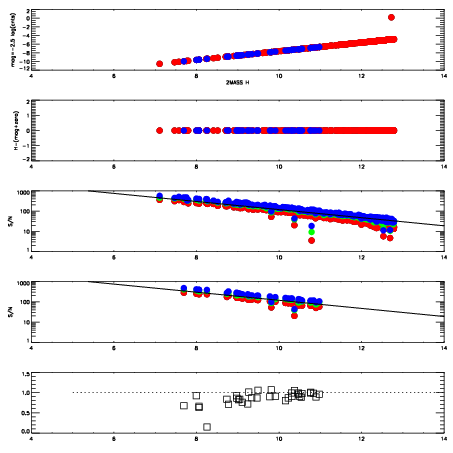
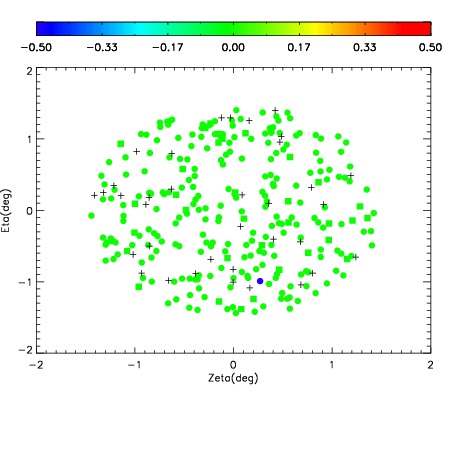
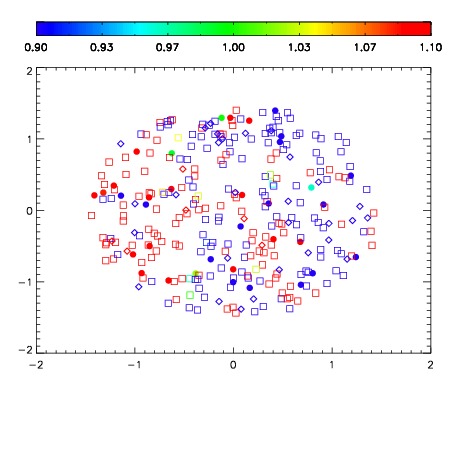
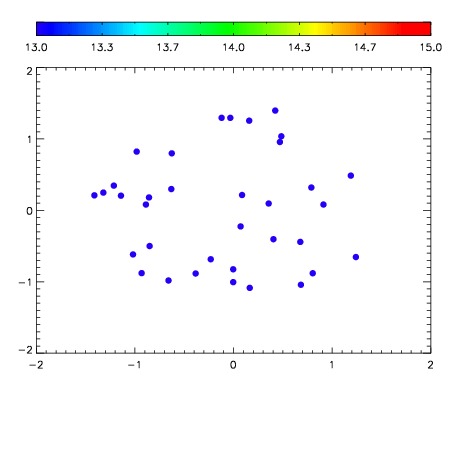

| Frame | Nreads | Zeropoints | Mag plots | Spatial mag deviation | Spatial sky 16325A emission deviations (filled: sky, open: star) | Spatial sky continuum emission | Spatial sky telluric CO2 absorption deviations (filled: H < 10) | |||||||||||||||||||||||
| 0 | 0 |
|
|
|
|
|
|
| IPAIR | NAME | SHIFT | NEWSHIFT | S/N | NAME | SHIFT | NEWSHIFT | S/N |
| 0 | 10530040 | 0.495610 | 0.00000 | 238.043 | 10530037 | -0.00670324 | 0.502313 | 233.176 |
| 1 | 10530036 | 0.493481 | 0.00212899 | 246.956 | 10530041 | -0.00805156 | 0.503662 | 246.385 |
| 2 | 10530035 | 0.493694 | 0.00191599 | 240.717 | 10530038 | -0.00649032 | 0.502100 | 241.072 |
| 3 | 10530039 | 0.494861 | 0.000748992 | 233.156 | 10530034 | 0.00000 | 0.495610 | 225.740 |