| Red | Green | Blue | |
| z | 17.64 | ||
| znorm | Inf | ||
| sky | -Inf | -Inf | -Inf |
| S/N | 25.6 | 44.0 | 50.1 |
| S/N(c) | 0.0 | 0.0 | 0.0 |
| SN(E/C) |
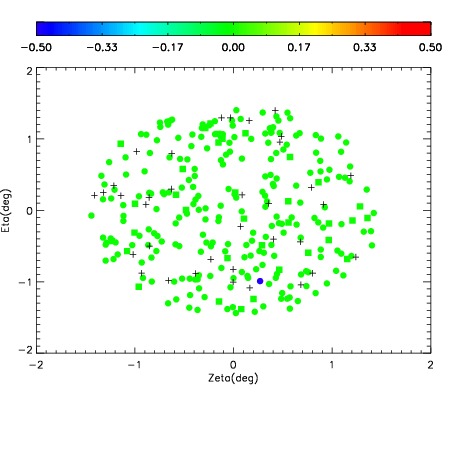
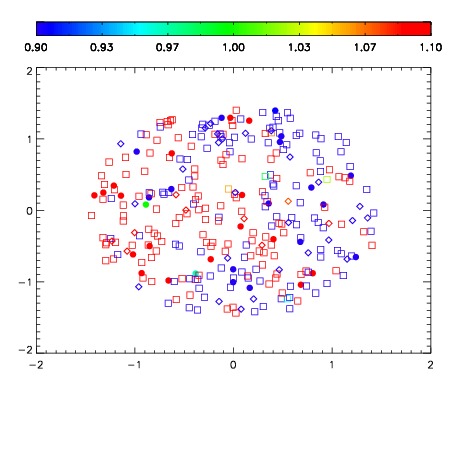
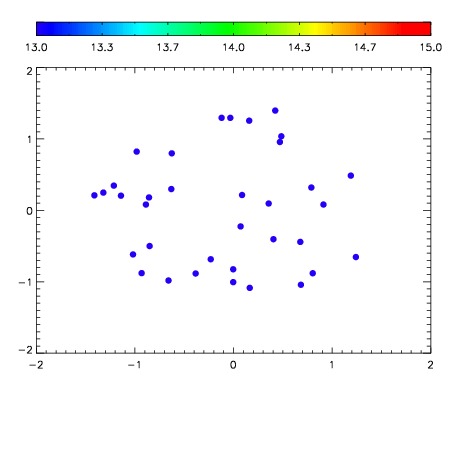

| Frame | Nreads | Zeropoints | Mag plots | Spatial mag deviation | Spatial sky 16325A emission deviations (filled: sky, open: star) | Spatial sky continuum emission | Spatial sky telluric CO2 absorption deviations (filled: H < 10) | |||||||||||||||||||||||
| 0 | 0 |
|
|
|
|
|
|
| IPAIR | NAME | SHIFT | NEWSHIFT | S/N | NAME | SHIFT | NEWSHIFT | S/N |
| 0 | 10800050 | 0.489858 | 0.00000 | 239.346 | 10800055 | 0.000114551 | 0.489743 | 248.666 |
| 1 | 10800054 | 0.488459 | 0.00139901 | 243.650 | 10800051 | -0.00159097 | 0.491449 | 249.698 |
| 2 | 10800053 | 0.488004 | 0.00185400 | 237.372 | 10800052 | -0.00138900 | 0.491247 | 244.212 |
| 3 | 10800049 | 0.489065 | 0.000793010 | 207.010 | 10800048 | 0.00000 | 0.489858 | 230.782 |