| Red | Green | Blue | |
| z | 17.64 | ||
| znorm | Inf | ||
| sky | -Inf | -Inf | -Inf |
| S/N | 36.1 | 61.6 | 65.0 |
| S/N(c) | 0.0 | 0.0 | 0.0 |
| SN(E/C) |
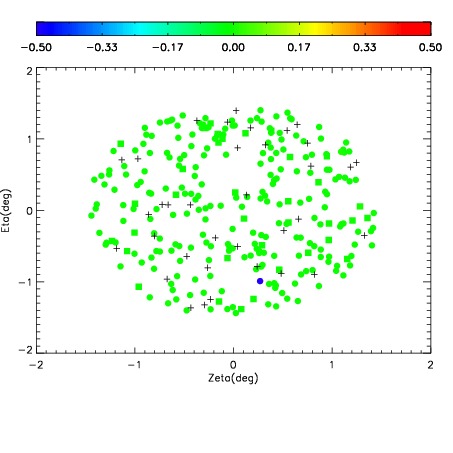
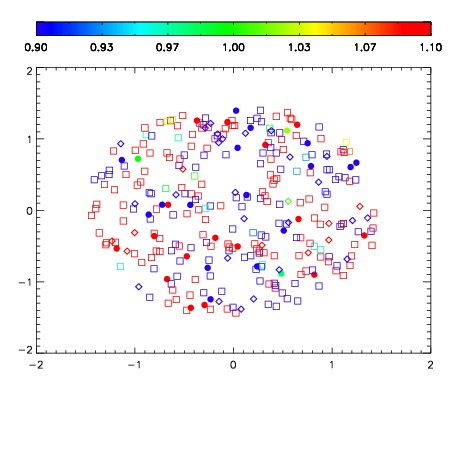
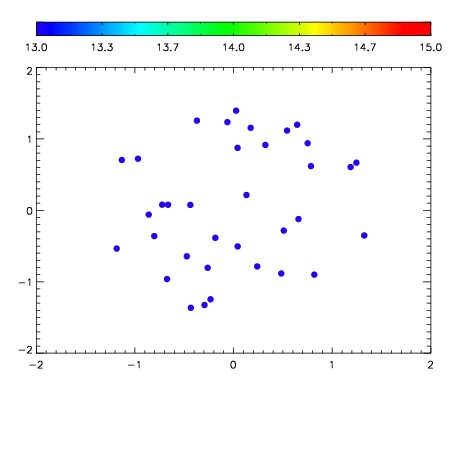

| Frame | Nreads | Zeropoints | Mag plots | Spatial mag deviation | Spatial sky 16325A emission deviations (filled: sky, open: star) | Spatial sky continuum emission | Spatial sky telluric CO2 absorption deviations (filled: H < 10) | |||||||||||||||||||||||
| 0 | 0 |
|
|
|
|
|
|
| IPAIR | NAME | SHIFT | NEWSHIFT | S/N | NAME | SHIFT | NEWSHIFT | S/N |
| 0 | 10290020 | 0.491201 | 0.00000 | 255.209 | 10290022 | 0.00251005 | 0.488691 | 254.114 |
| 1 | 10290021 | 0.491101 | 0.000100017 | 256.399 | 10290019 | 0.00462524 | 0.486576 | 256.292 |
| 2 | 10290017 | 0.489404 | 0.00179702 | 251.121 | 10290018 | 0.00472100 | 0.486480 | 251.514 |
| 3 | 10290012 | 0.490520 | 0.000681013 | 245.428 | 10290015 | 0.00407217 | 0.487129 | 245.630 |
| 4 | 10290016 | 0.489165 | 0.00203601 | 240.933 | 10290011 | 0.00000 | 0.491201 | 239.575 |
| 5 | 10290013 | 0.490240 | 0.000961006 | 234.897 | 10290014 | 0.00462495 | 0.486576 | 234.658 |