| Red | Green | Blue | |
| z | 17.64 | ||
| znorm | Inf | ||
| sky | -Inf | -Inf | -Inf |
| S/N | 24.6 | 43.1 | 46.0 |
| S/N(c) | 0.0 | 0.0 | 0.0 |
| SN(E/C) |
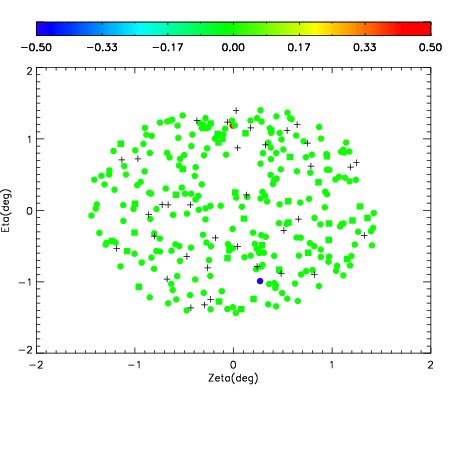
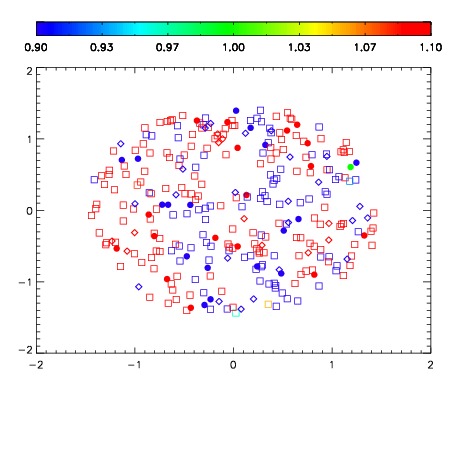
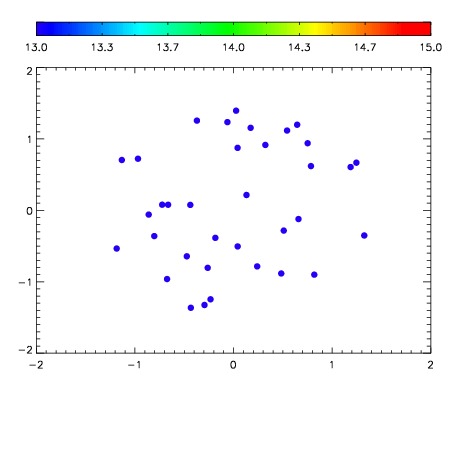

| Frame | Nreads | Zeropoints | Mag plots | Spatial mag deviation | Spatial sky 16325A emission deviations (filled: sky, open: star) | Spatial sky continuum emission | Spatial sky telluric CO2 absorption deviations (filled: H < 10) | |||||||||||||||||||||||
| 0 | 0 |
|
|
|
|
|
|
| IPAIR | NAME | SHIFT | NEWSHIFT | S/N | NAME | SHIFT | NEWSHIFT | S/N |
| 0 | 10810037 | 0.488017 | 0.00000 | 225.259 | 10810035 | 0.00000 | 0.488017 | 223.264 |
| 1 | 10810036 | 0.487160 | 0.000856996 | 226.380 | 10810038 | -0.000383614 | 0.488401 | 225.176 |
| 2 | 10810040 | 0.487011 | 0.00100601 | 215.177 | 10810039 | -0.000136255 | 0.488153 | 220.257 |
| 3 | 10810041 | 0.486822 | 0.00119498 | 210.826 | 10810042 | -0.000650954 | 0.488668 | 216.698 |