| Red | Green | Blue | |
| z | 17.64 | ||
| znorm | Inf | ||
| sky | -Inf | -Inf | -Inf |
| S/N | 27.1 | 48.5 | 51.1 |
| S/N(c) | 0.0 | 0.0 | 0.0 |
| SN(E/C) |

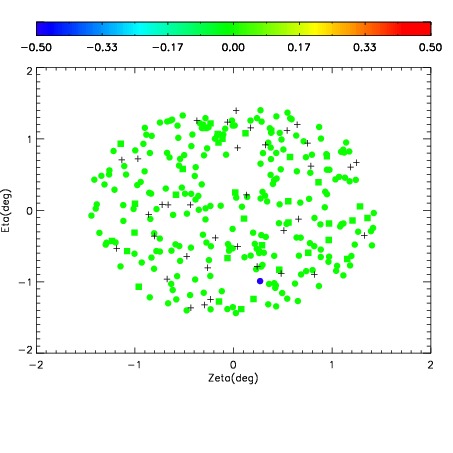
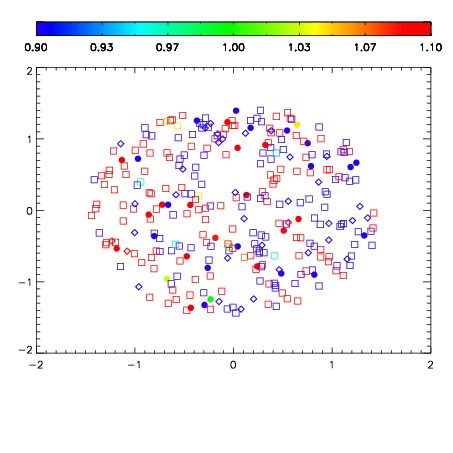
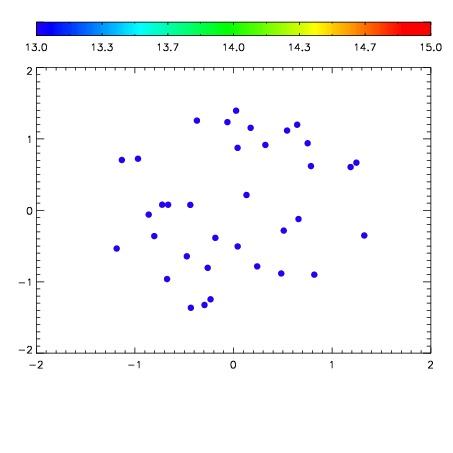

| Frame | Nreads | Zeropoints | Mag plots | Spatial mag deviation | Spatial sky 16325A emission deviations (filled: sky, open: star) | Spatial sky continuum emission | Spatial sky telluric CO2 absorption deviations (filled: H < 10) | |||||||||||||||||||||||
| 0 | 0 |
|
|
|
|
|
|
| IPAIR | NAME | SHIFT | NEWSHIFT | S/N | NAME | SHIFT | NEWSHIFT | S/N |
| 0 | 10880042 | 0.501707 | 0.00000 | 229.495 | 10880039 | 0.000317206 | 0.501390 | 234.721 |
| 1 | 10880037 | 0.500604 | 0.00110304 | 240.699 | 10880036 | 0.00000 | 0.501707 | 238.272 |
| 2 | 10880038 | 0.500791 | 0.000916004 | 237.949 | 10880043 | -0.000936141 | 0.502643 | 235.348 |
| 3 | 10880041 | 0.501329 | 0.000378013 | 220.353 | 10880040 | 0.000549670 | 0.501157 | 230.044 |